Time Left - 12:00 mins
Attempt now to get your rank among 2159 students!
Question 1
Directions: Study the bar diagram and answer these questions.
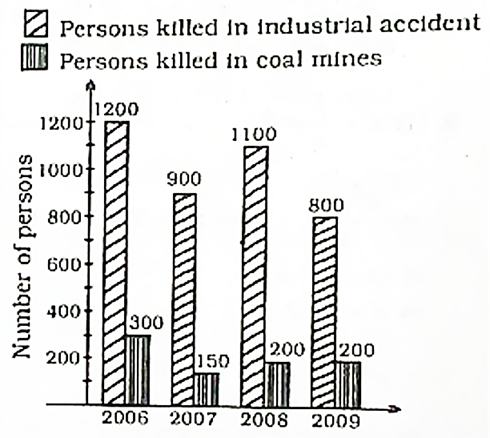
The number of persons killed in coal mines in 2006 was what per cent of those killed in industrial accidents in that year?
Question 2
Directions: Study the bar diagram and answer these questions.
In which year, minimum number of persons were killed in industrial accidents and coal mines together?
Question 3
Directions: Study the bar diagram and answer these questions.
In which year, maximum number of persons were killed in industrial accidents other than those killed in coalmines?
Question 4
Directions: Study the bar diagram and answer these questions.
In which year, minimum number of persons were killed in coal mimes other than those killed in industrial accidents?
Question 5
Directions: Study the bar diagram and answer these questions.
In a year, on average, how many persons were killed in industrial accidents and coal mimes together?
Question 6
Direction: Study the following table carefully to answer the questions that follow:

Monthly rent (in thousands) at five different places in six different years
In which place(s), the monthly rent did increase consistently from the year 2005 to 2010?
Question 7
Direction: Study the following table carefully to answer the questions that follow:
Monthly rent (in thousands) at five different places in six different years
In which year at Church-gate, the monthly rent increased more than 100% from the previous year?
Question 8
Direction: Study the following table carefully to answer the questions that follow:
Monthly rent (in thousands) at five different places in six different years
What was the difference between the monthly rent at Dadar in the year 2009 and Borivali in the year 2007?
Question 9
Direction: Study the following table carefully to answer the questions that follow:
Monthly rent (in thousands) at five different places in six different years
Monthly rent at Kandivali in the year 2008 was approximately what percent of the total monthly rent at Virar over all the years together?
Question 10
Direction: Study the following table carefully to answer the questions that follow:
Monthly rent (in thousands) at five different places in six different years
Which city was most expensive in terms of rent?
- 2159 attempts
- 32 upvotes
- 141 comments
Oct 6SSC & Railway

