Time Left - 25:00 mins
Data Interpretation Quiz 9
Attempt now to get your rank among 231 students!
Question 1
Directions: Study the following graph and answer the questions below.

In how many six months the increase in the price of crude oil was more than 10% with respect to the corresponding previous years?
Question 2
Directions: Study the following graph and answer the questions below.
If in April the curde oil price would have been lesser than the given by ₹ 223 per metric tonne, then how much would have been the percentage increase in price over the earlier month?
Question 3
Directions: Study the following graph and answer the questions below.
Which months(s) experienced more than 10% but less than 20% increase in the price of crude oil over the earlier month?
Question 4
Directions: Study the following graph and answer the questions below.
What is the approximate percentage increase in the price of crude oil from February to Septmber?
Question 5
Directions: Study the following graph carefully and answer the questions given below it.
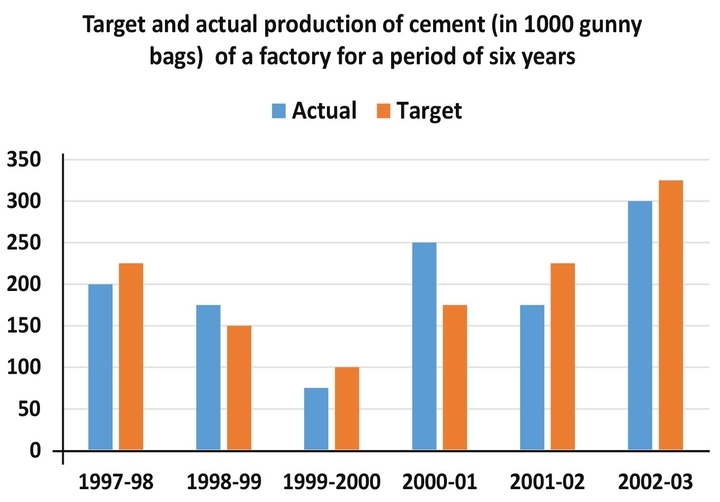
If the combined targeted production of two adjacent years in compared to the combined actual production (of these two years) then in which of the following pairs of years will it have a complete match?
Question 6
Directions: Study the following graph carefully and answer the questions given below it.
What was the difference between the target set and the actual production for year 2001-01 (unit gunny bags)?
Question 7
Directions: Study the following graph carefully and answer the questions given below it.
In which of the following years was the actual production as percentage of target production the highest?
Question 8
Directions: Study the following graph carefully and answer the questions given below it.
The actual production of cement for 1997-98 was how many times that of the target set for that year?
Question 9
Read the following information and graph and answer the questions that follow.
An international Organisation produces a Competitive Index of countries every two years based on eight factors (Institutions, Infrastructure, Macroeconomic Environment, Higher Education, Market Efficiency, Technological Readiness, Business Sophistication and Innovation). The last three indices were developed in 2010, 2012 and 2014. The scores for all eight factors of XYZ country are shown in the graph below:

An international Organisation produces a Competitive Index of countries every two years based on eight factors (Institutions, Infrastructure, Macroeconomic Environment, Higher Education, Market Efficiency, Technological Readiness, Business Sophistication and Innovation). The last three indices were developed in 2010, 2012 and 2014. The scores for all eight factors of XYZ country are shown in the graph below:
If Factor performance is measured as 0.30 X Factor Score in 2014 + 0.35 X Factor Score in 2012 + 0.35 X Factor Score in 2010, then which of the following has best Factor Performance?
Question 10
Read the following information and graph and answer the questions that follow.
An international Organisation produces a Competitive Index of countries every two years based on eight factors (Institutions, Infrastructure, Macroeconomic Environment, Higher Education, Market Efficiency, Technological Readiness, Business Sophistication and Innovation). The last three indices were developed in 2010, 2012 and 2014. The scores for all eight factors of XYZ country are shown in the graph below:
An international Organisation produces a Competitive Index of countries every two years based on eight factors (Institutions, Infrastructure, Macroeconomic Environment, Higher Education, Market Efficiency, Technological Readiness, Business Sophistication and Innovation). The last three indices were developed in 2010, 2012 and 2014. The scores for all eight factors of XYZ country are shown in the graph below:
If Factor Performance is measured as

then which of the following has best Factor Performance?
then which of the following has best Factor Performance?
Question 11
Read the following information and graph and answer the questions that follow.
An international Organisation produces a Competitive Index of countries every two years based on eight factors (Institutions, Infrastructure, Macroeconomic Environment, Higher Education, Market Efficiency, Technological Readiness, Business Sophistication and Innovation). The last three indices were developed in 2010, 2012 and 2014. The scores for all eight factors of XYZ country are shown in the graph below:
An international Organisation produces a Competitive Index of countries every two years based on eight factors (Institutions, Infrastructure, Macroeconomic Environment, Higher Education, Market Efficiency, Technological Readiness, Business Sophistication and Innovation). The last three indices were developed in 2010, 2012 and 2014. The scores for all eight factors of XYZ country are shown in the graph below:
Which of the following factor has the highest average score across indices of 2010, 2012 and 2014?
Question 12
Read the following information and graph and answer the questions that follow.
An international Organisation produces a Competitive Index of countries every two years based on eight factors (Institutions, Infrastructure, Macroeconomic Environment, Higher Education, Market Efficiency, Technological Readiness, Business Sophistication and Innovation). The last three indices were developed in 2010, 2012 and 2014. The scores for all eight factors of XYZ country are shown in the graph below:
An international Organisation produces a Competitive Index of countries every two years based on eight factors (Institutions, Infrastructure, Macroeconomic Environment, Higher Education, Market Efficiency, Technological Readiness, Business Sophistication and Innovation). The last three indices were developed in 2010, 2012 and 2014. The scores for all eight factors of XYZ country are shown in the graph below:
Which among the following factor had the least growth rate in 2014 versus scores of 2010?
- 231 attempts
- 1 upvote
- 6 comments
Sep 3CAT & MBA

