Time Left - 08:00 mins
Attempt now to get your rank among 1968 students!
Question 1
Direction: Study the following radar chart and answer the question that follows.

Trade Deficit = Total Imports – Total Exports
What is the total Trade deficit over all the years together?
Question 2
Direction: Study the following radar chart and answer the question that follows.
Trade Deficit = Total Imports – Total Exports
Total trade deficit for the years 2008 and 2012 together is what percent of the total trade deficit for the years 2009 and 2010 together?
Question 3
Direction: Study the following radar chart and answer the question that follows.
Trade Deficit = Total Imports – Total Exports
If the imports of one of the year is doubled, then the ratio of export to import of that years goes up to 2 : 3, what is the original trade deficit in that year?
Question 4
Direction: Study the following radar chart and answer the question that follows.
Trade Deficit = Total Imports – Total Exports
Total imports over the given years is what percent of the total exports over the given years?
Question 5
Direction: Study the following radar chart and answer the question that follows.
Trade Deficit = Total Imports – Total Exports
What is the ratio of the years in which exports are greater than imports to the years in which imports are greater than exports?
Question 6
Direction: Study the following radar graph carefully and answer the questions that follow:
Number of students (in thousands) in two different universities in six different years.
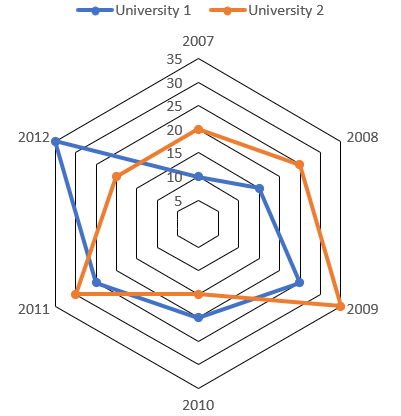
What was the difference between the number of students in university 1 in the year 2010 and the number of students in university 2 in the year 2012?
Question 7
Direction: Study the following radar graph carefully and answer the questions that follow:
Number of students (in thousands) in two different universities in six different years.
What is the sum of the number of students in university 1 in the year 2007 and the number of students in university 2 in the year 2011 together?
Question 8
Direction: Study the following radar graph carefully and answer the questions that follow:
Number of students (in thousands) in two different universities in six different years.
If 25% of the students in university 2 in the year 2010 were females, what was the number of male students in the university 2 in the same year?
Question 9
Direction: Study the following radar graph carefully and answer the questions that follow:
Number of students (in thousands) in two different universities in six different years.
What was the percent increase in the number of students in university 1 in the year 2011 compared to the previous year?
Question 10
Direction: Study the following radar graph carefully and answer the questions that follow:
Number of students (in thousands) in two different universities in six different years.
In which year the difference between the number of students in university 1 and the number of students in university 2 was highest?
- 1968 attempts
- 30 upvotes
- 77 comments
Feb 25PO, Clerk, SO, Insurance

