Time Left - 10:00 mins
Attempt now to get your rank among 1578 students!
Question 1
Direction: The following chart shows the percentage distribution of total selected candidates in an entrance examination from six different cities(A, B, C, D, E, F) during the year 2013 and 2014 and the table shows the ratio of male to female candidates among the selected candidates in the 6 cities.
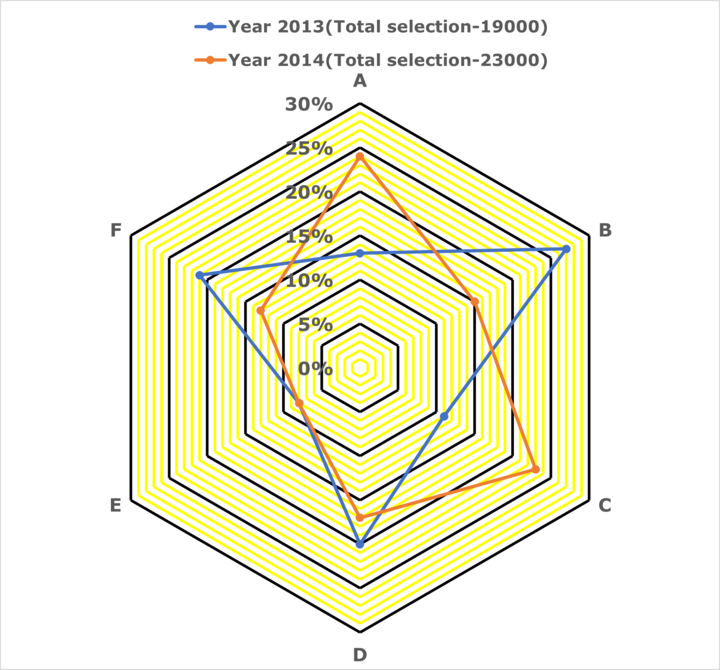
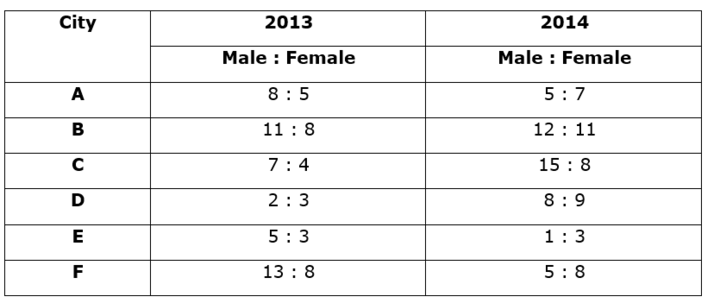
What is the difference between the number of total male candidates selected from City B in 2013 and total male candidates selected from City A in 2014?
Question 2
Direction: The following chart shows the percentage distribution of total selected candidates in an entrance examination from six different cities(A, B, C, D, E, F) during the year 2013 and 2014 and the table shows the ratio of male to female candidates among the selected candidates in the 6 cities.
What is the ratio of total females selected from City D in 2013 to total females selected from City E in 2014?
Question 3
Direction: The following chart shows the percentage distribution of total selected candidates in an entrance examination from six different cities(A, B, C, D, E, F) during the year 2013 and 2014 and the table shows the ratio of male to female candidates among the selected candidates in the 6 cities.
The total number of females selected from City F in 2013 is what percentage of the total number of candidates selected from City E in that year?
Question 4
Direction: The following chart shows the percentage distribution of total selected candidates in an entrance examination from six different cities(A, B, C, D, E, F) during the year 2013 and 2014 and the table shows the ratio of male to female candidates among the selected candidates in the 6 cities.
The total number of females selected from City B in 2014 is approximately what per cent more than the total number of males selected from City E in 2013?
Question 5
Direction: The following chart shows the percentage distribution of total selected candidates in an entrance examination from six different cities(A, B, C, D, E, F) during the year 2013 and 2014 and the table shows the ratio of male to female candidates among the selected candidates in the 6 cities.
What is the average number of females selected from all cities together in 2014?
Question 6
Direction: Study the following pie-charts carefully and answer the questions:

The following graph represents percentage of number of employees in five departments of an organisation for two consecutive years.

In which of the following departments, the variation in the number of employees was minimum between 2013 and 2014?
Question 7
Direction: Study the following pie-charts carefully and answer the questions:
The following graph represents percentage of number of employees in five departments of an organisation for two consecutive years.
If 2400 employees joined the department A in 2013 then how many employees joined the department C in the same year?
Question 8
Direction: Study the following pie-charts carefully and answer the questions:
The following graph represents percentage of number of employees in five departments of an organisation for two consecutive years.
What was the approximate percentage increase in the number of employees in department C in 2014 as compared to the year 2013?
Question 9
Direction: Study the following pie-charts carefully and answer the questions:
The following graph represents percentage of number of employees in five departments of an organisation for two consecutive years.
What was the difference between the number of employees in department D in 2013 and number of employees in department B in 2014?
Question 10
Direction: Study the following pie-charts carefully and answer the questions:
The following graph represents percentage of number of employees in five departments of an organisation for two consecutive years.
If 1200 employees of department E left the organization in 2013 then how many additional employees might have joined the organization in department E in 2014 as compared to 2013?
- 1578 attempts
- 26 upvotes
- 48 comments
Nov 5PO, Clerk, SO, Insurance

