Time Left - 20:00 mins
Mini Mock on Network Theory & Control System for ESE 2018
Attempt now to get your rank among 259 students!
Question 1
A two port network is represented by ABCD parameters given by

If port-2 is terminated by RL the input impedance seen at port-1 is given by
If port-2 is terminated by RL the input impedance seen at port-1 is given by
Question 2
Consider the network graph shown in figure. Which one of the following is NOT a ‘tree’ of this graph?

Question 3
With 10 V dc connected at port A in the linear nonreciprocal two-port network shown below, the following were observed:
(i) 1 Ω connected at port B draws a current of 3 A
(ii) 2.5 Ω connected at port B draws a current of 2 A

With 10 V dc connected at port A. the current drawn by 7 Ω connected at port B is
(i) 1 Ω connected at port B draws a current of 3 A
(ii) 2.5 Ω connected at port B draws a current of 2 A
With 10 V dc connected at port A. the current drawn by 7 Ω connected at port B is
Question 4
In the AC network shown in the figure, the phasor voltage VAB (in Volts) is:

Question 5
The time domain behavior of an RL circuit is represented by

For an initial current of , the steady state value of the current is given by
For an initial current of
Question 6
If R1 = R2 = R4=R and R3 = 1.1R in the bridge circuit shown in figure, then the reading in the ideal voltmeter connected between a and b is

Question 7
For maximum power transfer between two cascaded sections of an electrical network, the relationship between the output impedance Z1 of the first section to the input impedance Z2 of the second section is
Question 8
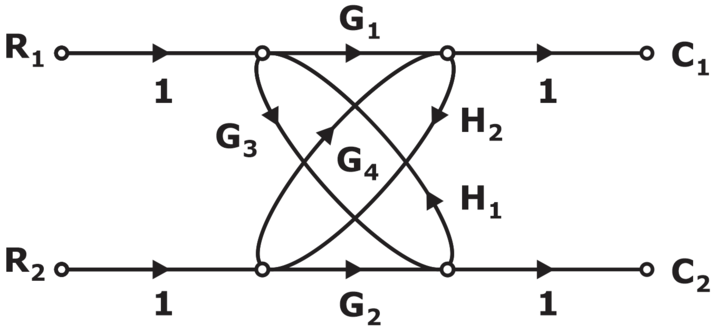
The transfer function  for the given signal flow graph is
Question 9
Consider a closed loop transfer function  with p a positive real parameter. The maximum value of p until which
  remains stable is ________.
Question 10
Consider the feedback system shown in the figure. The Nyquist plot of G(s) is also shown.
Which one of the following conclusions is correct?


Which one of the following conclusions is correct?
Question 11
Which one of the following options correctly describes the locations of the roots of the equation s 4+s 2+1 =0 on the complex plane?
Question 12
The state diagram of a system is shown below. A system is described by the state-variable equations


The state variable equations of the system in the figure above are:
The state variable equations of the system in the figure above are:
Question 13
The state transition matrix  of the system shown in the figure above is
Question 14
The Bode plot of a transfer function G(s) is shown in the figure below.

The gain (20 log|G(s)| ) is 32 dB and –8 dB at 1 rad/s and 10 rads/s respectively. The phase is negative for all ω. Then G(s) is
- 259 attempts
- 3 upvotes
- 3 comments
Tags :
ESE & GATE EEGeneralJul 26ESE & GATE EE

