Time Left - 07:00 mins
Attempt now to get your rank among 1759 students!
Question 1
The bar chart represents sales of four companies C1, C2, C3 and C4 (in millions) for the year 2012, 2013 and 2014. Consider the bar chart and answer questions based on it.
 .
.
.The ratio of combined sales of C1 and C4 in the year 2013 to that of year 2012 is
Question 2
The bar chart represents sales of four companies C1, C2, C3 and C4 (in millions) for the year 2012, 2013 and 2014. Consider the bar chart and answer questions based on it.
.
.Which two companies showed increase in their sales from 2012 to 2013?
Question 3
The bar chart represents sales of four companies C1, C2, C3 and C4 (in millions) for the year 2012, 2013 and 2014. Consider the bar chart and answer questions based on it.
.
.The combined sales of C2 in 2012 and 2014 is how much more than that of C3 for the sames year?
Question 4
Study the following diagram and answer questions based on it.
The diagram represents the favourite ice-cream flavors of kids in a society.
 .
.
The diagram represents the favourite ice-cream flavors of kids in a society.
.How many kids like both Chocolate and Vanilla but not Strawberry?
Question 5
Study the following diagram and answer questions based on it.
The diagram represents the favourite ice-cream flavors of kids in a society.
.
The diagram represents the favourite ice-cream flavors of kids in a society.
.How many kids like Strawberry but not Vanilla?
Question 6
Study the following diagram and answer questions based on it.
The diagram represents the favourite ice-cream flavors of kids in a society.
.
The diagram represents the favourite ice-cream flavors of kids in a society.
.The ratio of kids who like Vanilla to those who like Chocolate is
Question 7
The line graph shows the number of students who passed with distinction in the given year from a certain university. Study the diagram and the answer the following questions.
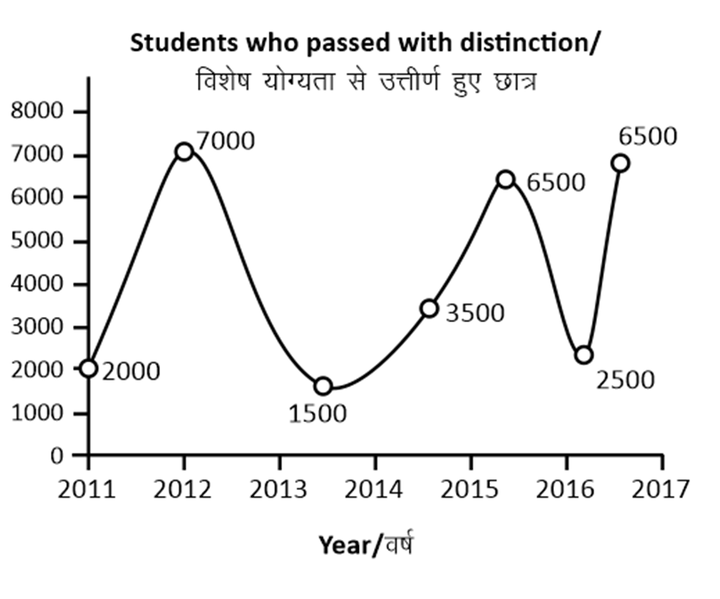
In which year were number of students who passed with distinction were lesser than those who passed in the previous year?
Question 8
The line graph shows the number of students who passed with distinction in the given year from a certain university. Study the diagram and the answer the following questions.
What was the difference in the number of students who passed with distinction between the years 2017 and 2014?
Question 9
The line graph shows the number of students who passed with distinction in the given year from a certain university. Study the diagram and the answer the following questions.
Number of students who passed with distinction in 2012 were greater than that in 2011 by ________.
Question 10
The line graph shows the number of students who passed with distinction in the given year from a certain university. Study the diagram and the answer the following questions.
If students who pass with distinction are given a certificate, what is the number of certificates awarded in the last three years?
- 1759 attempts
- 8 upvotes
- 20 comments
Oct 28SSC & Railway

