Time Left - 10:00 mins
CLAT 2020 | Table Chart Quiz 1 | 27.11.2019
Attempt now to get your rank among 193 students!
Question 1
Direction: The following table represents the sales (in million) of hour companies for five years. Consider the table the answer the questions based on it.

Which company’s total sales in the first three years is lowest among others?
(A) YO
(B) HO
(C) KO
(D) TO
Question 2
Direction: The following table represents the sales (in million) of hour companies for five years. Consider the table the answer the questions based on it.
What is the difference in the total sales of companies KO and HO in the last three years?
(A) 200 million
(B) 195million
(C) 5million
(D) No difference
Question 3
The given bar chart shows production of steel by companies A, B, C and D for years 2014, 2015, 2016 (in tonnes).
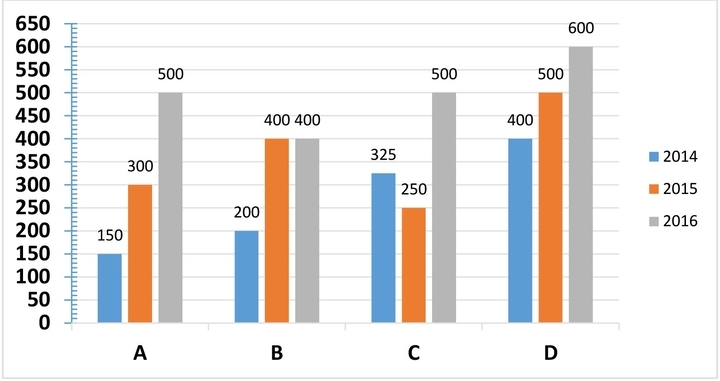
In the given bar-chart, which company has the maximum total production of steel?
Question 4
The given bar chart shows production of steel by companies A, B, C and D for years 2014, 2015, 2016(in tonnes).
In the given bar-chart, what is the percentage producation of ‘B’ in 2014 to the total producation of 2014?
Question 5
The given bar chart production of steel by companies A,B,C and D for years 2014, 2015, 2016( in tonnes).
In the given bar-chart, the average production of steel at ‘C’ for the year 2014 – 2016 is :
- 193 attempts
- 5 upvotes
- 15 comments
Sep 1CLAT UG

