Quantitative Techniques || Mixed Quiz || 13.07.2020
Attempt now to get your rank among 170 students!
Question 1
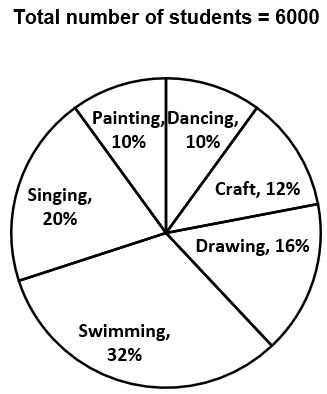
In 2016, students of a school, enrolled for different activities - Dancing, Craft, Drawing, Swimming, Singing and Painting in a school fest.
In the below pie - chart, percentage distribution of total students enrolled for different activities is given.
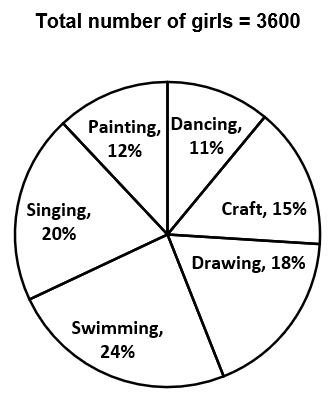
In the below pie - chart, percentage distribution of girls student enrolled for different activities is given.
In 2016, in which activity the least number of boys are enrolled?
Question 2
In 2016, students of a school, enrolled for different activities - Dancing, Craft, Drawing, Swimming, Singing and Painting in a school fest.
In the below pie - chart, percentage distribution of total students enrolled for different activities is given.
In the below pie - chart, percentage distribution of girls student enrolled for different activities is given.
If the 25% of the boys, who enrolled in singing change their enrollment to painting, then the respective ratio of total number of students enrolled in painting and drawing is
Question 3
Question 4
Question 5
Question 6
Question 7
Question 8
Question 9
Question 10
- 170 attempts
- 2 upvotes
- 5 comments

