SUPERB 30 Quizzes: Day 11 - Line Chart and Bar Graph
Attempt now to get your rank among 1977 students!
Question 1
Direction: The given Bar graph represents the number of students passed in the annual examination from class 6th to 10th of Viswanathan Public school and there are total 1750 students in the school and each class has 350 students. study the graph and answer the following questions.
What is the percentage of passed students from class 6th and 8th together of the total number of passed students from all the classes together?
Question 2
Direction: The given Bar graph represents the number of students passed in the annual examination from class 6th to 10th of Viswanathan Public school and there are total 1750 students in the school and each class has 350 students. study the graph and answer the following questions.
If the number of students in only class 8th is increased by 10% and number of passed students in the same is increased by 20% then find out the difference between number of students passed in class 8th and number of students passed in class 6th?
Question 3
Direction: The given Bar graph represents the number of students passed in the annual examination from class 6th to 10th of Viswanathan Public school and there are total 1750 students in the school and each class has 350 students. study the graph and answer the following questions.
After the scrutiny, the principal finds that some students of class 10th got the passing marks after doing cheating and he declared 20% of the passed students of 10th as failed and then after a bit more scrutiny, he gets to know that of the remaining students, 10 were also involved in the cheating and declared them failed as well. Find the ratio of Passed students of class 10th to the passed students of class 9th.
Question 4
Direction: The given Bar graph represents the number of students passed in the annual examination from class 6th to 10th of Viswanathan Public school and there are total 1750 students in the school and each class has 350 students. study the graph and answer the following questions.
If the number of total students in the school is increased by 20% and the number of passed students in class 6th to 10th increased by 20%, 25%, 20% 10% and 10% respectively, then find out the percentage of total passed students to the number of total students in the school?
Question 5
Direction: The given Bar graph represents the number of students passed in the annual examination from class 6th to 10th of Viswanathan Public school and there are total 1750 students in the school and each class has 350 students. study the graph and answer the following questions.
If X more students took admission in class 6th and they all are passed. Now passed students in class 6th is 10% more than students passed in class 9th, find out the value of X.
Question 6
Directions:The following bar graph shows the percentage break-up of a Sunil’s salary from year 2012 to 2016. With the given information, find the following questions.
If the ratio on saving in the year 2013 and 2016 are in the ratio 3 : 5. Then what is the ratio of EMI expenses in the year 2013 and 2016.
Question 7
Directions:The following bar graph shows the percentage break-up of a Sunil’s salary from year 2012 to 2016. With the given information, find the following questions.
If the saving in 2012 is thof the saving in 2014. Then what is the total expenditure spent on food in 2012. (Given that total expense in 2014 is INR 1,85,000)
Question 8
Directions:The following bar graph shows the percentage break-up of a Sunil’s salary from year 2012 to 2016. With the given information, find the following questions.
Every year there is an increase of 100% in monthly salary as compared to previous year’s monthly salary then what is the ratio of monthly salary in 2016 to the expenses on travelling in 2013.
Question 9
Directions:The following bar graph shows the percentage break-up of a Sunil’s salary from year 2012 to 2016. With the given information, find the following questions.
If the total expenses in year 2011 is INR 3, 00,000 and there is an increase of 18% in 2012. Then how much Sunil has spent on travelling and EMI combine in 2012?
Question 10
Directions:The following bar graph shows the percentage break-up of a Sunil’s salary from year 2012 to 2016. With the given information, find the following questions.
What approx. percentage of average money spend by Sunil on food to that of average money saved by him during all these years if his salary per annum was INR 5,00,000
Question 11
Direction: Study the line graph carefully and answer the given questions.
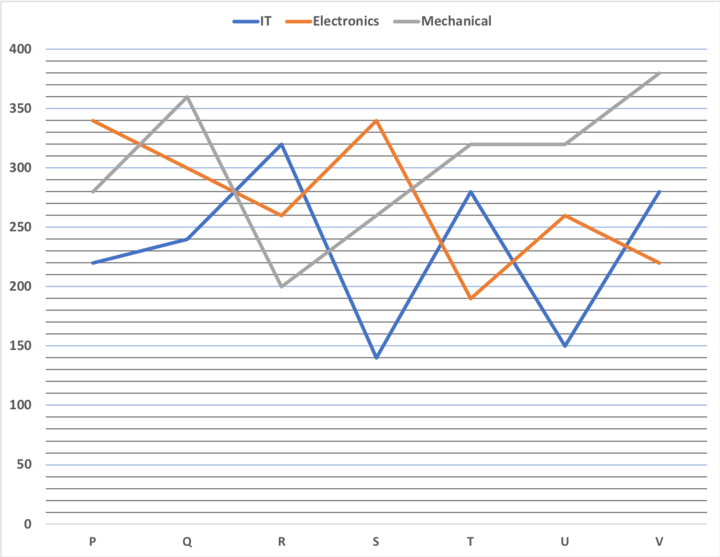
Strength of Seven Technology Institutes with Specializations in IT, Electronics and Mechanical in 2012
If the number of students with Mechanical specialization in each institute increased by 20% and the number of students with IT specialization in each institute decreased by 10% from 2012-13, what is the difference between total mechanical student to total IT student in 2013.
Question 12
Direction: Study the line graph carefully and answer the given questions.
Strength of Seven Technology Institutes with Specializations in IT, Electronics and Mechanical in 2012
What is the ratio between total number of students in institutes R and V respectively?
Question 13
Direction: Study the line graph carefully and answer the given questions.
Strength of Seven Technology Institutes with Specializations in IT, Electronics and Mechanical in 2012
What is the difference between total number of students with Electronics specialization from all the institutes together and the total number of students with Mechanical specialization from all the institutes together?
Question 14
Direction: Study the line graph carefully and answer the given questions.
Strength of Seven Technology Institutes with Specializations in IT, Electronics and Mechanical in 2012
If the number of students in institutes P, Q and R with IT specialization increased by 15%, 22% and 10% respectively from 2012 to 13, what was the total number of students with IT specialization in the three institutes together in 2013?
Question 15
Direction: Study the line graph carefully and answer the given questions.
Strength of Seven Technology Institutes with Specializations in IT, Electronics and Mechanical in 2012
In institutes P, T and U the percentage of girls out of total number of students with Electronics specialization in respective institute is 50%, 55% and 48% respectively, what is the approx total number of boys in these three institutes with Electronics specialization?
Question 16
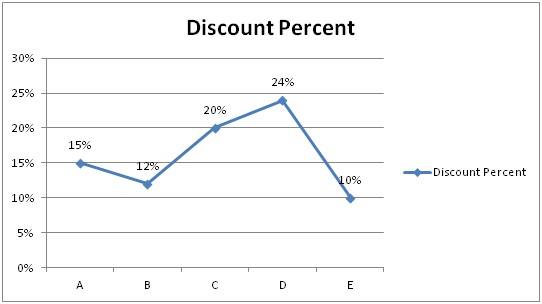
Directions: Answer the questions based on the information given below. The line graphs given below shows the discount percent on five different items A, B, C, D and E and it also shows the profit/loss amount (in Rs.) of these 5 items when sold. Note: Positive values indicate the profit amount while negative values represent loss amount.
If marked up percent for item A is 20% on its cost price and discount amount offered on item D is Rs. 2100, then marked up amount of item D is what percent of discount offered on item A?
Question 17
Directions: Answer the questions based on the information given below. The line graphs given below shows the discount percent on five different items A, B, C, D and E and it also shows the profit/loss amount (in Rs.) of these 5 items when sold. Note: Positive values indicate the profit amount while negative values represent loss amount.
If the markup in price of item A is Rs. 3000 and ratio of market price of item A and C is 120: 23, then mark up amount of item C is approximately what percent of discount offered on item A?
Question 18
Directions: Answer the questions based on the information given below. The line graphs given below shows the discount percent on five different items A, B, C, D and E and it also shows the profit/loss amount (in Rs.) of these 5 items when sold. Note: Positive values indicate the profit amount while negative values represent loss amount.
If there is another item F who’s marked up amount is 20% more than that of item C and discount rate offered on F is 15%. After selling item F shopkeeper earns 14.75% profit, then what is the ratio of cost price of item C to F if cost price of tem C is Rs. 8000?
Question 19
Directions: Answer the questions based on the information given below. The line graphs given below shows the discount percent on five different items A, B, C, D and E and it also shows the profit/loss amount (in Rs.) of these 5 items when sold. Note: Positive values indicate the profit amount while negative values represent loss amount.
If the owner exchange the marked up percent and discount percent offered on item B, then what is the difference between new and original selling price of item B. Also given that the total value of discount given on item B is Rs. 900.
Question 20
Directions: Answer the questions based on the information given below. The line graphs given below shows the discount percent on five different items A, B, C, D and E and it also shows the profit/loss amount (in Rs.) of these 5 items when sold. Note: Positive values indicate the profit amount while negative values represent loss amount.
Shopkeeper sold items D and E together and incurred a loss of on item D and earned profit on E, then cost price of item E is less than by what amount of the cost price of item D?