Time Left - 16:00 mins
Attempt now to get your rank among 2438 students!
Question 1
Direction: Answer the questions based on the information given below:
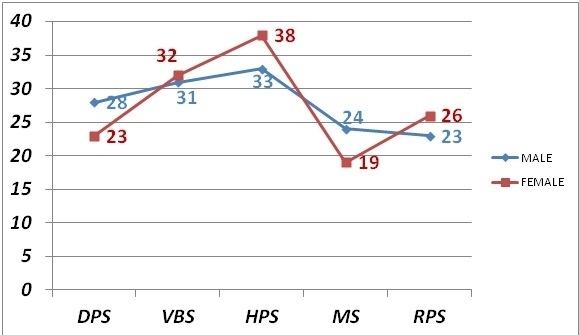
The first line graph represents the average number of female customers and male customers per organisation who live in building of five different headquarters.
The second line graph represents the total number of female customers and male customers in five different headquarters.
Note 1: There are total 12 organisations in each headquarter.
Note 2: Total number of customers in headquarters = Number of customer who live in building + number of part timers.
What is the difference between the number of part timers’ male customers and the number of part timers’ female customers in VBS?
Question 2
Direction: Answer the questions based on the information given below:
The first line graph represents the average number of female customers and male customers per organisation who live in building of five different headquarters.
The second line graph represents the total number of female customers and male customers in five different headquarters.
Note 1: There are total 12 organisations in each headquarter.
Note 2: Total number of customers in headquarters = Number of customer who live in building + number of part timers.
What is the average number of customers per organisation who are part timers’ in RPS?
Question 3
Direction: Answer the questions based on the information given below:
The first line graph represents the average number of female customers and male customers per organisation who live in building of five different headquarters.
The second line graph represents the total number of female customers and male customers in five different headquarters.
Note 1: There are total 12 organisations in each headquarter.
Note 2: Total number of customers in headquarters = Number of customer who live in building + number of part timers.
The first line graph represents the average number of female customers and male customers per organisation who live in building of five different headquarters.
The second line graph represents the total number of female customers and male customers in five different headquarters.
Note 1: There are total 12 organisations in each headquarter.
Note 2: Total number of customers in headquarters = Number of customer who live in building + number of part timers.
What is the ratio of the number of male customers who are part timers in DPS to the number of male customers who are part timers in HPS?
Question 4
Direction: Answer the questions based on the information given below:
The first line graph represents the average number of female customers and male customers per organisation who live in building of five different headquarters.
The second line graph represents the total number of female customers and male customers in five different headquarters.
Note 1: There are total 12 organisations in each headquarter.
Note 2: Total number of customers in headquarters = Number of customer who live in building + number of part timers.
The first line graph represents the average number of female customers and male customers per organisation who live in building of five different headquarters.
The second line graph represents the total number of female customers and male customers in five different headquarters.
Note 1: There are total 12 organisations in each headquarter.
Note 2: Total number of customers in headquarters = Number of customer who live in building + number of part timers.
Find the percentage of the number of female customers who are part timers in MS with respect to the number of male customers who are part timers in the same headquarter.
Question 5
Direction: Answer the questions based on the information given below:
The first line graph represents the average number of female customers and male customers per organisation who live in building of five different headquarters.
The second line graph represents the total number of female customers and male customers in five different headquarters.
Note 1: There are total 12 organisations in each headquarter.
Note 2: Total number of customers in headquarters = Number of customer who live in building + number of part timers.
The first line graph represents the average number of female customers and male customers per organisation who live in building of five different headquarters.
The second line graph represents the total number of female customers and male customers in five different headquarters.
Note 1: There are total 12 organisations in each headquarter.
Note 2: Total number of customers in headquarters = Number of customer who live in building + number of part timers.
Find the difference between the total number of female customers who live in building in all the five headquarters together and the total number of male customers who live in building in all the five headquarters together.
Question 6
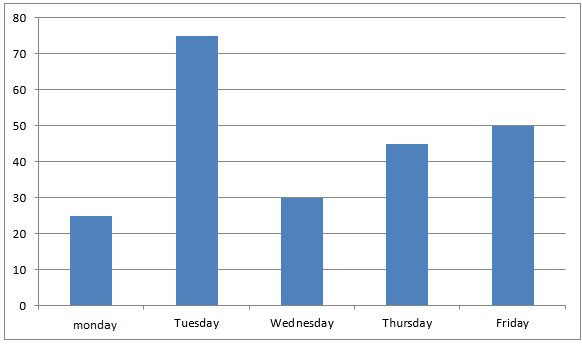
Direction: Bar graph given below shows pens sold by a retailer on five different days. Study the data carefully and answer the following questions.
Number of pen sold by a retailer on five different days.
Number of pen sold by a retailer on five different days.
Out of total pens sold on Tuesday, the ratio between the number of defective pens sold to total number of pens sold is 7 : 15. Find the total number of non - defective pens sold on Tuesday by the retailer.
Question 7
Direction: Bar graph given below shows pens sold by a retailer on five different days. Study the data carefully and answer the following questions.
Number of pen sold by a retailer on five different days.
Number of pen sold by a retailer on five different days.
Total number of pens sold on Saturday is 40% more than total number of pens sold on Wednesday. Find the total number of pens sold on Friday and Saturday together.
Question 8
Direction: Bar graph given below shows pens sold by a retailer on five different days. Study the data carefully and answer the following questions.
Number of pen sold by a retailer on five different days.
Number of pen sold by a retailer on five different days.
Find the difference between the total number of pens sold on Monday and Tuesday together to the total number of pens sold on Thursday and Friday together.
Question 9
Direction: Bar graph given below shows pens sold by a retailer on five different days. Study the data carefully and answer the following questions.
Number of pen sold by a retailer on five different days.
Number of pen sold by a retailer on five different days.
The total number of pens sold on Tuesday is 25% more than the total number of pens sold on Sunday. Find the total number of pens sold on Sunday.
Question 10
Direction: Bar graph given below shows pens sold by a retailer on five different days. Study the data carefully and answer the following questions.
Number of pen sold by a retailer on five different days.
Number of pen sold by a retailer on five different days.
Out of the total pens sold on Thursday, 20% were blue ink pens. Out of the remaining, 25% were red ink pens and the remaining were black ink pens. Find the total number of blue and black ink pens sold on Thursday.
Question 11
Direction: Read the table carefully and answer the related questions to etc. The above table represents the population of a certain city.

What is the ratio of total no. of women living in Cuttack to men living in Rourkela?
Question 12
Direction: Read the table carefully and answer the related questions to etc. The above table represents the population of a certain city.
What is the percentage of children living in Angul of those living in Bhubaneswar?
Question 13
Direction: Read the table carefully and answer the related questions to etc. The above table represents the population of a certain city.
What is the average percentage of people live in the cities?
Question 14
Direction: Read the table carefully and answer the related questions to etc. The above table represents the population of a certain city.
What is the total no. of women and children living in Sambalpur?
Question 15
Direction: Read the table carefully and answer the related questions to etc. The above table represents the population of a certain city.
What is the average no. of men living in Cuttack, Angul and Sambalpur?
Question 16
Direction: In the table data is given about some persons. Some data is given and some data is hidden. Study the given data carefully and answer the related questions.

Salary of A is what percent more/less than that of B ?
Question 17
Direction: In the table data is given about some persons. Some data is given and some data is hidden. Study the given data carefully and answer the related questions.
What is average salary of all six persons ?
Question 18
Direction: In the table data is given about some persons. Some data is given and some data is hidden. Study the given data carefully and answer the related questions.
What is difference between average expenditure and average saving of all six persons ?
Question 19
Direction: In the table data is given about some persons. Some data is given and some data is hidden. Study the given data carefully and answer the related questions.
What is the respective ratio of expenditure of B and that of E ?
Question 20
Direction: In the table data is given about some persons. Some data is given and some data is hidden. Study the given data carefully and answer the related questions.
What is the respective ratio of percentage of saving of D and B ?
- 2438 attempts
- 6 upvotes
- 23 comments
Sep 8PO, Clerk, SO, Insurance

