Time Left - 16:00 mins
Attempt now to get your rank among 903 students!
Question 1
Direction: Study the following information and answer the related questions.
P, Q, R, S, T, A, B, C, D and E are employees of a company. A table shows the average age of any two employees of the company. The average age of A and B is 27.5.

i.e average age of A & P is given as (A+P)/2=39.5
P, Q, R, S, T, A, B, C, D and E are employees of a company. A table shows the average age of any two employees of the company. The average age of A and B is 27.5.
i.e average age of A & P is given as (A+P)/2=39.5
What is the age of T?
Question 2
Direction: Study the following information and answer the related questions.
P, Q, R, S, T, A, B, C, D and E are employees of a company. A table shows the average age of any two employees of the company. The average age of A and B is 27.5.
i.e average age of A & P is given as (A+P)/2=39.5
P, Q, R, S, T, A, B, C, D and E are employees of a company. A table shows the average age of any two employees of the company. The average age of A and B is 27.5.
i.e average age of A & P is given as (A+P)/2=39.5
What is the average age of D, R and S?
Question 3
Direction: Study the following information and answer the related questions.
P, Q, R, S, T, A, B, C, D and E are employees of a company. A table shows the average age of any two employees of the company. The average age of A and B is 27.5.
i.e average age of A & P is given as (A+P)/2=39.5
P, Q, R, S, T, A, B, C, D and E are employees of a company. A table shows the average age of any two employees of the company. The average age of A and B is 27.5.
i.e average age of A & P is given as (A+P)/2=39.5
What is the ratio of ages of Q and E?
Question 4
Direction: Study the following information and answer the related questions.
P, Q, R, S, T, A, B, C, D and E are employees of a company. A table shows the average age of any two employees of the company. The average age of A and B is 27.5.
i.e average age of A & P is given as (A+P)/2=39.5
P, Q, R, S, T, A, B, C, D and E are employees of a company. A table shows the average age of any two employees of the company. The average age of A and B is 27.5.
i.e average age of A & P is given as (A+P)/2=39.5
What will be the average of sum of ages of A, B, C, D and E together after five years?
Question 5
Direction: Study the following information and answer the related questions.
P, Q, R, S, T, A, B, C, D and E are employees of a company. A table shows the average age of any two employees of the company. The average age of A and B is 27.5.
i.e average age of A & P is given as (A+P)/2=39.5
P, Q, R, S, T, A, B, C, D and E are employees of a company. A table shows the average age of any two employees of the company. The average age of A and B is 27.5.
i.e average age of A & P is given as (A+P)/2=39.5
If age of P and Q is decreased by 50% and age of A and B is increased by 20%, what will be the ratio of ages of P, Q, R, S and T together to the ages of A, B, C, D and E together?
Question 6
Directions:The following bar graph shows the percentage break-up of a Sunil’s salary from year 2012 to 2016. With the given information, find the following questions.

If the ratio on saving in the year 2013 and 2016 are in the ratio 3 : 5. Then what is the ratio of EMI expenses in the year 2013 and 2016.
Question 7
Directions:The following bar graph shows the percentage break-up of a Sunil’s salary from year 2012 to 2016. With the given information, find the following questions.
If the saving in 2012 is  th of the saving in 2014. Then what is the total expenditure spent on food in 2012. (Given that total expense in 2014 is INR 1,85,000)
Question 8
Directions:The following bar graph shows the percentage break-up of a Sunil’s salary from year 2012 to 2016. With the given information, find the following questions.
Every year there is an increase of 100% in monthly salary as compared to previous year’s monthly salary then what is the ratio of monthly salary in 2016 to the expenses on travelling in 2013.
Question 9
Directions:The following bar graph shows the percentage break-up of a Sunil’s salary from year 2012 to 2016. With the given information, find the following questions.
If the total expenses in year 2011 is INR 3, 00,000 and there is an increase of 18% in 2012. Then how much Sunil has spent on travelling and EMI combine in 2012?
Question 10
Directions:The following bar graph shows the percentage break-up of a Sunil’s salary from year 2012 to 2016. With the given information, find the following questions.
What approx. percentage of average money spend by Sunil on food to that of average money saved by him during all these years if his salary per annum was INR 5,00,000
Question 11
Direction: Refer to the pie-chart and answer the given questions.
A report on the post preparation and placement of engineering students after graduations in a state in a year:
No. of total graduate engineering students = 35000

A report on the post preparation and placement of engineering students after graduations in a state in a year:
No. of total graduate engineering students = 35000
The no. of students preparing for IES is approximately what percent of the no. of students preparing for GATE?
Question 12
Direction: Refer to the pie-chart and answer the given questions.
A report on the post preparation and placement of engineering students after graduations in a state in a year:
No. of total graduate engineering students = 35000
A report on the post preparation and placement of engineering students after graduations in a state in a year:
No. of total graduate engineering students = 35000
Find the ratio between the no. of students placed in companies and the no. of students preparing for M.Tech.
Question 13
Direction: Refer to the pie-chart and answer the given questions.
A report on the post preparation and placement of engineering students after graduations in a state in a year:
No. of total graduate engineering students = 35000
A report on the post preparation and placement of engineering students after graduations in a state in a year:
No. of total graduate engineering students = 35000
If the total no. of graduate engineering students is increased by 15% in the next year and the percentage of students preparing for govt. jobs is increased by 2% point and the percentage of students preparing for IES is decreased by 4% point, find the total no. of students preparing for govt. jobs and IES together in next year.
Question 14
Direction: Refer to the pie-chart and answer the given questions.
A report on the post preparation and placement of engineering students after graduations in a state in a year:
No. of total graduate engineering students = 35000
A report on the post preparation and placement of engineering students after graduations in a state in a year:
No. of total graduate engineering students = 35000
What is the difference between the no. of students preparing for GATE and M.Tech?
Question 15
Direction: Refer to the pie-chart and answer the given questions.
A report on the post preparation and placement of engineering students after graduations in a state in a year:
No. of total graduate engineering students = 35000
A report on the post preparation and placement of engineering students after graduations in a state in a year:
No. of total graduate engineering students = 35000
What is the central angle corresponding to the no. of students preparing for MBA?
Question 16
Directions: Answer the questions based on the information given below.
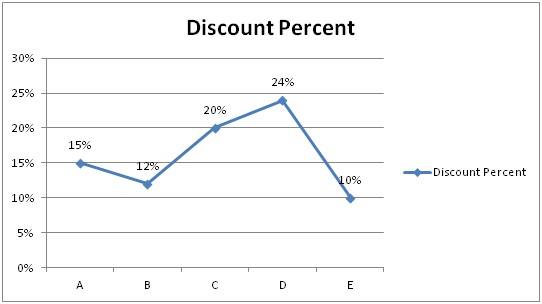
The line graphs given below shows the discount percent on five different items A, B, C, D and E and it also shows the profit/loss amount (in Rs.) of these 5 items when sold.
Note: Positive values indicate the profit amount while negative values represent loss amount.

The line graphs given below shows the discount percent on five different items A, B, C, D and E and it also shows the profit/loss amount (in Rs.) of these 5 items when sold.
Note: Positive values indicate the profit amount while negative values represent loss amount.
If marked up percent for item A is 20% on its cost price and discount amount offered on item D is Rs. 2100, then marked up amount of item D is what percent of discount offered on item A?
Question 17
Directions: Answer the questions based on the information given below.
The line graphs given below shows the discount percent on five different items A, B, C, D and E and it also shows the profit/loss amount (in Rs.) of these 5 items when sold.
Note: Positive values indicate the profit amount while negative values represent loss amount.
The line graphs given below shows the discount percent on five different items A, B, C, D and E and it also shows the profit/loss amount (in Rs.) of these 5 items when sold.
Note: Positive values indicate the profit amount while negative values represent loss amount.
If the markup in price of item A is Rs. 3000 and ratio of market price of item A and C is 120: 23, then mark up amount of item C is approximately what percent of discount offered on item A?
Question 18
Directions: Answer the questions based on the information given below.
The line graphs given below shows the discount percent on five different items A, B, C, D and E and it also shows the profit/loss amount (in Rs.) of these 5 items when sold.
Note: Positive values indicate the profit amount while negative values represent loss amount.
The line graphs given below shows the discount percent on five different items A, B, C, D and E and it also shows the profit/loss amount (in Rs.) of these 5 items when sold.
Note: Positive values indicate the profit amount while negative values represent loss amount.
If there is another item F who’s marked up amount is 20% more than that of item C and discount rate offered on F is 15%. After selling item F shopkeeper earns 14.75% profit, then what is the ratio of cost price of item C to F if cost price of tem C is Rs. 8000?
Question 19
Directions: Answer the questions based on the information given below.
The line graphs given below shows the discount percent on five different items A, B, C, D and E and it also shows the profit/loss amount (in Rs.) of these 5 items when sold.
Note: Positive values indicate the profit amount while negative values represent loss amount.
The line graphs given below shows the discount percent on five different items A, B, C, D and E and it also shows the profit/loss amount (in Rs.) of these 5 items when sold.
Note: Positive values indicate the profit amount while negative values represent loss amount.
If the owner exchange the marked up percent and discount percent offered on item B, then what is the difference between new and original selling price of item B. Also given that the total value of discount given on item B is Rs. 900.
Question 20
Directions: Answer the questions based on the information given below.
The line graphs given below shows the discount percent on five different items A, B, C, D and E and it also shows the profit/loss amount (in Rs.) of these 5 items when sold.
Note: Positive values indicate the profit amount while negative values represent loss amount.
The line graphs given below shows the discount percent on five different items A, B, C, D and E and it also shows the profit/loss amount (in Rs.) of these 5 items when sold.
Note: Positive values indicate the profit amount while negative values represent loss amount.
Shopkeeper sold items D and E together and incurred a loss of  on item D and earned
  profit on E, then cost price of item E is less than by what amount of the cost price of item D?
- 903 attempts
- 4 upvotes
- 1 comment
Dec 8PO, Clerk, SO, Insurance

