Time Left - 16:00 mins
Attempt now to get your rank among 1039 students!
Question 1
Direction: Study the line graph carefully and answer the given questions.
Strength of Seven Technology Institutes with Specializations in IT, Electronics and Mechanical in 2012
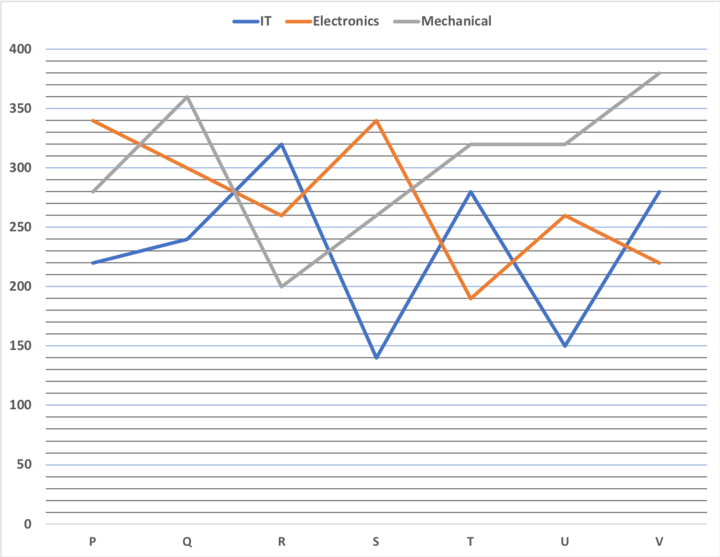
If the number of students with Mechanical specialization in each institute increased by 20% and the number of students with IT specialization in each institute decreased by 10% from 2012-13, what is the difference between total mechanical student to total IT student in 2013.
Question 2
Direction: Study the line graph carefully and answer the given questions.
Strength of Seven Technology Institutes with Specializations in IT, Electronics and Mechanical in 2012
What is the ratio between total number of students in institutes R and V respectively?
Question 3
Direction: Study the line graph carefully and answer the given questions.
Strength of Seven Technology Institutes with Specializations in IT, Electronics and Mechanical in 2012
What is the difference between total number of students with Electronics specialization from all the institutes together and the total number of students with Mechanical specialization from all the institutes together?
Question 4
Direction: Study the line graph carefully and answer the given questions.
Strength of Seven Technology Institutes with Specializations in IT, Electronics and Mechanical in 2012
If the number of students in institutes P, Q and R with IT specialization increased by 15%, 22% and 10% respectively from 2012 to 13, what was the total number of students with IT specialization in the three institutes together in 2013?
Question 5
Direction: Study the line graph carefully and answer the given questions.
Strength of Seven Technology Institutes with Specializations in IT, Electronics and Mechanical in 2012
In institutes P, T and U the percentage of girls out of total number of students with Electronics specialization in respective institute is 50%, 55% and 48% respectively, what is the approx total number of boys in these three institutes with Electronics specialization?
Question 6
Direction: Study the line graph carefully and answer the given questions.
The graph shows the total number of events organized by two companies i.e. A and B in different states of India in these six years.

The graph shows the total number of events organized by two companies i.e. A and B in different states of India in these six years.
The total number of events organized by company A in 2012 and 2014 together approximately is what percentage more than that of the total number of events organized by company B in 2013 and 2017 together?
Question 7
Direction: Study the line graph carefully and answer the given questions.
The graph shows the total number of events organized by two companies i.e. A and B in different states of India in these six years.
The graph shows the total number of events organized by two companies i.e. A and B in different states of India in these six years.
If in 2013, each company A and B organized the events in same two states i.e. state 1 and state 2. The total number of events organized by company A and B together in state 2 is 120 in 2013 and the ratio of the total number of events organized by company A in state 1 to company B in state 1 in 2013 is 3 : 2. Calculate the total number of events organized by company B in state 1 in 2013.
Question 8
Direction: Study the line graph carefully and answer the given questions.
The graph shows the total number of events organized by two companies i.e. A and B in different states of India in these six years.
The graph shows the total number of events organized by two companies i.e. A and B in different states of India in these six years.
What is the average of the total number of events organized by company B in all these years?
Question 9
Direction: Study the line graph carefully and answer the given questions.
The graph shows the total number of events organized by two companies i.e. A and B in different states of India in these six years.
The graph shows the total number of events organized by two companies i.e. A and B in different states of India in these six years.
If in 2016, company A organized the events in four different states from state 1 to state 4. If the total number of events organized by company A in state 2 and state 4 together is 80 and the total number of events organized by company A in state 3 is twice the number of events organized by company A in state 1. Then find the total number of events organized by company A in state 1. (All the date is given for 2016)
Question 10
Direction: Study the line graph carefully and answer the given questions.
The graph shows the total number of events organized by two companies i.e. A and B in different states of India in these six years.
The graph shows the total number of events organized by two companies i.e. A and B in different states of India in these six years.
What is the difference between the total number of events organized by company A in 2014, 2015 and 2016 together to the total number of events organized by company B in 2013, 2014 and 2016 together?
Question 11
Directions: Study the following table carefully to answer the questions that follow
In the table below, the number of executives recruited in the given years by six different organizations - P, Q, R, S, T and U is given.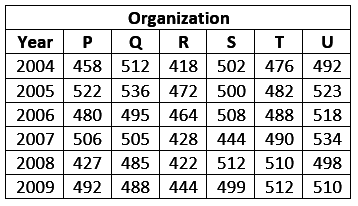
What is the total number of Executives recruited by all the organizations together in the year 2006?
Question 12
Directions: Study the following table carefully to answer the questions that follow
In the table below, the number of executives recruited in the given years by six different organizations - P, Q, R, S, T and U is given.
What is the respective ratio of total number of executives recruited by organization U in the year 2007 and 2009 together to the total number of executives recruited by organization P in the same years?
Question 13
Directions: Study the following table carefully to answer the questions that follow
In the table below, the number of executives recruited in the given years by six different organizations - P, Q, R, S, T and U is given.
What is the approximate average number of executives recruited by organization S over all the given years together?
Question 14
Directions: Study the following table carefully to answer the questions that follow
In the table below, the number of executives recruited in the given years by six different organizations - P, Q, R, S, T and U is given.
What is the percent increase in the number of executives recruited by organization R in 2005 over the previous year? (rounded off to two digits after decimal)
Question 15
Directions: Study the following table carefully to answer the questions that follow
In the table below, the number of executives recruited in the given years by six different organizations - P, Q, R, S, T and U is given.
Number of executives recruited by organization T in the year 2008 forms approximately what per cent of the total number of executives recruited by all the organizations together in that year?
Question 16
Direction: Study the line graph carefully and answer the given questions.
The following line graph shows the number of people who attended the workshop A and B on 5 different days.

The following line graph shows the number of people who attended the workshop A and B on 5 different days.
What is the ratio of the number of people who attended the workshop A and B together on Monday to that of A and B together on Wednesday?
Question 17
Direction: Study the line graph carefully and answer the given questions.
The following line graph shows the number of people who attended the workshop A and B on 5 different days.
The following line graph shows the number of people who attended the workshop A and B on 5 different days.
If the number of females who attended the workshop A and B together on Tuesday is 460 and the ratio of male to female who attended the workshop A on Tuesday is 3:2 then how many male members attended the workshop B on Tuesday?
Question 18
Direction: Study the line graph carefully and answer the given questions.
The following line graph shows the number of people who attended the workshop A and B on 5 different days.
The following line graph shows the number of people who attended the workshop A and B on 5 different days.
What is the difference between the total number of people who attended the workshop A on Monday and Thursday and the number of people who attended the workshop B on the same days?
Question 19
Direction: Study the line graph carefully and answer the given questions.
The following line graph shows the number of people who attended the workshop A and B on 5 different days.
The following line graph shows the number of people who attended the workshop A and B on 5 different days.
The total male members who attended the workshop A and B together on Saturday is 470. The total male members who attended the workshop A and B together on Friday is 60 more than that of the total female members who attended the workshop A and B together on Friday then what is the difference between the number of males who attended the workshop A and B on Friday to the number of males who attended the workshop A and B on Saturday?
Question 20
Direction: Study the line graph carefully and answer the given questions.
The following line graph shows the number of people who attended the workshop A and B on 5 different days.
The following line graph shows the number of people who attended the workshop A and B on 5 different days.
The number of people who attended the workshop A and B together on Wednesday is what percent of the number of people who attended the workshop A and B together on Thursday?
- 1039 attempts
- 5 upvotes
- 10 comments
Dec 17PO, Clerk, SO, Insurance

