Time Left - 12:00 mins
CLAT 2021 Free Revision Plan II DI Quiz II 29.04.2021
Attempt now to get your rank among 68 students!
Question 1
Directions: In the following questions, study the two pie-charts and answer the questions.
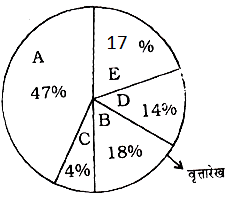

April month’s salary : 24000
A – Education
B – Saving
C – Grocery
D – Electricity and Phone Bills
E – Miscellaneous
May month’s salary : 25000
What is the percent increase in Education in May month than April month?
Question 2
Directions: In the following questions, study the two pie-charts and answer the questions.
April month’s salary : 24000
A – Education
B – Saving
C – Grocery
D – Electricity and Phone Bills
E – Miscellaneous
May month’s salary : 25000
The ratio of amount of saving in April month’s salary and miscellaneous in May month’s salary is :
Question 3
Directions: In the following questions, study the two pie-charts and answer the questions.
April month’s salary : 24000
A – Education
B – Saving
C – Grocery
D – Electricity and Phone Bills
E – Miscellaneous
May month’s salary : 25000
From the salary of May, the amount spent on Grocery and Electricity are :
Question 4
Directions: In the following questions, study the two pie-charts and answer the questions.
April month’s salary : 24000
A – Education
B – Saving
C – Grocery
D – Electricity and Phone Bills
E – Miscellaneous
May month’s salary : 25000
The average amount spent on Education, Grocery and Savings from April month’s salary is :
Question 5
Direction: Population of five adjacent areas of a town, in the year of 2010, are represented in the following Pie-chart. The ratio of the numbers of males to that of female in these areas is stated in the table below. The total of the population in all the five areas is 72 lakh. Study the Pie-chart and the table and then answer the questions.

12 lakh is the population of the area:
Question 6
Direction: Population of five adjacent areas of a town, in the year of 2010, are represented in the following Pie-chart. The ratio of the numbers of males to that of female in these areas is stated in the table below. The total of the population in all the five areas is 72 lakh. Study the Pie-chart and the table and then answer the questions.
The number of males in the area S1 and S4 together is
Question 7
Direction: Population of five adjacent areas of a town, in the year of 2010, are represented in the following Pie-chart. The ratio of the numbers of males to that of female in these areas is stated in the table below. The total of the population in all the five areas is 72 lakh. Study the Pie-chart and the table and then answer the questions.
The ratio of number of females in the area S2 to that in the area S5 is:
Question 8
Direction: The pie chart given below shows the percentage of time taken by different process in making a car.

If total time taken to make a car is 300 hours, then what is the total time (in hours) taken in paint and frame?
Question 9
Direction: The pie chart given below shows the percentage of time taken by different process in making a car.
If time taken in seats is 192 hours, then what is the time taken (in hours) in glass?
Question 10
Direction: The pie chart given below shows the percentage of time taken by different process in making a car.
If total time taken in engine and tyres is 127.5 hours, then what is the difference (in hours) in time taken by frame and glass respectively?
- 68 attempts
- 0 upvotes
- 0 comments
Apr 29CLAT UG

