Time Left - 15:00 mins
Table || Data interpretation || CAT 2021 || 10 May
Attempt now to get your rank among 235 students!
Question 1
Direction: Study the following table carefully and answer the questions given below:
The following table shows the monthly expenditure (in Rs. thousands) by five students on Rent, Food, Education, Cloths and Travelling.

The following table shows the monthly expenditure (in Rs. thousands) by five students on Rent, Food, Education, Cloths and Travelling.
What is the total monthly expenditure made by S on rent, Q on clothes and T on travelling?
Question 2
Direction: Study the following table carefully and answer the questions given below:
The following table shows the monthly expenditure (in Rs. thousands) by five students on Rent, Food, Education, Cloths and Travelling.
The following table shows the monthly expenditure (in Rs. thousands) by five students on Rent, Food, Education, Cloths and Travelling.
What is the average monthly expenditure on rent by all the students together?
Question 3
Direction: Study the following table carefully and answer the questions given below:
The following table shows the monthly expenditure (in Rs. thousands) by five students on Rent, Food, Education, Cloths and Travelling.
The following table shows the monthly expenditure (in Rs. thousands) by five students on Rent, Food, Education, Cloths and Travelling.
Which student has the lowest monthly expenditure among them in on all expenditure together?
Question 4
Direction: Study the following table carefully and answer the questions given below:
The following table shows the monthly expenditure (in Rs. thousands) by five students on Rent, Food, Education, Cloths and Travelling.
The following table shows the monthly expenditure (in Rs. thousands) by five students on Rent, Food, Education, Cloths and Travelling.
If the monthly expenditure of R on education is increased by 15%, then what will be his yearly expenditure on education?
Question 5
Directions: Study the table carefully to answer the questions that follow:

*Deaths and injuries are mutually exclusive.
The table given below shows the percentage-distribution of total number of 48000 accidents due to various variety of vehicles and the ratio of deaths to injuries.
*Deaths and injuries are mutually exclusive.
What is the number of injuries due to cycle accidents?
Question 6
Directions: Study the table carefully to answer the questions that follow:
*Deaths and injuries are mutually exclusive.
The table given below shows the percentage-distribution of total number of 48000 accidents due to various variety of vehicles and the ratio of deaths to injuries.
*Deaths and injuries are mutually exclusive.
The number of deaths due to car accidents is what percent of the total number of accidents due to cars?
Question 7
Directions: Study the table carefully to answer the questions that follow:
*Deaths and injuries are mutually exclusive.
The table given below shows the percentage-distribution of total number of 48000 accidents due to various variety of vehicles and the ratio of deaths to injuries.
*Deaths and injuries are mutually exclusive.
The number of injuries due to bus accidents is approximately what percent of the total accidents due to all the vehicles together?
Question 8
Direction: Study the table carefully and answer the given questions.
The table given below shows the percentage of Marks obtained by Various Students in Various Subjects in an Examination.
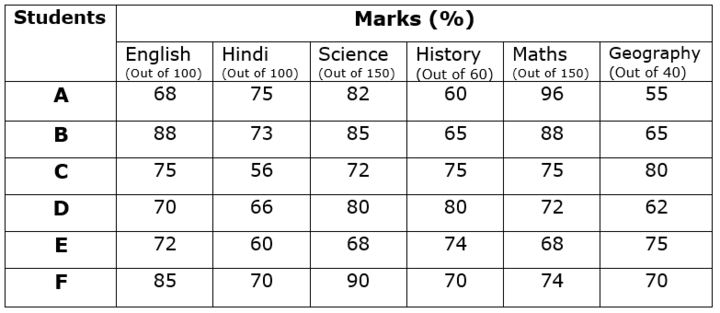
What is approximate overall percentage obtained by C in the examination?
Question 9
Direction: Study the table carefully and answer the given questions.
The table given below shows the percentage of Marks obtained by Various Students in Various Subjects in an Examination.
What is the difference in the marks obtained by B in English and Maths together and the marks obtained by F in the same subjects?
Question 10
Direction: Study the table carefully and answer the given questions.
The table given below shows the percentage of Marks obtained by Various Students in Various Subjects in an Examination.
The marks obtained by A in Geography are what percent of the marks obtained by E in Hindi?
- 235 attempts
- 0 upvotes
- 2 comments
Jun 25CAT & MBA

