Time Left - 10:00 mins
BBA & HM 2021 Free Study Plan II Bar Graph Quiz || 24.05.2021
Attempt now to get your rank among 27 students!
Question 1
Direction: Read the data carefully and answer the following questions.
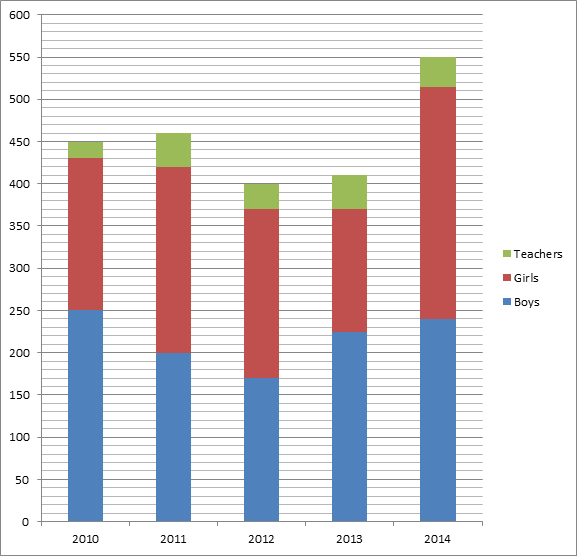
The figure below shows the no of boys, girls and teachers in DAV public school in different years.
The figure below shows the no of boys, girls and teachers in DAV public school in different years.
If the average weight of the school members in 2012 is 45 kg. The average weight of the teachers is 60 kg and the ratio of the average weight of the boys and girls is 2:3. What is the cumulative average weight of boys and girls? (approximately)
Question 2
Direction: Read the data carefully and answer the following questions.
The figure below shows the no of boys, girls and teachers in DAV public school in different years.
The figure below shows the no of boys, girls and teachers in DAV public school in different years.
What is the ratio of average of boys, girls and teachers in the school from 2010 to 2014?
Question 3
Direction: Read the data carefully and answer the following questions.
The figure below shows the no of boys, girls and teachers in DAV public school in different years.
The figure below shows the no of boys, girls and teachers in DAV public school in different years.
In how many years the no of teachers is greater than the average no of teachers?
Question 4
Direction: Read the data carefully and answer the following questions.
The figure below shows the no of boys, girls and teachers in DAV public school in different years.
The figure below shows the no of boys, girls and teachers in DAV public school in different years.
In which year, the change in the no of girls from the previous is highest?
Question 5
Direction: Read the data carefully and answer the following questions.
The figure below shows the no of boys, girls and teachers in DAV public school in different years.
The figure below shows the no of boys, girls and teachers in DAV public school in different years.
What is the 2nd lowest % decrease from the previous year ? (consider changes of boys, girls and teachers in all the years)
Question 6
Directions: Study the following graph carefully and answer the questions given below.
The following graph gives the profit percentage of three companies in different years.

The following graph gives the profit percentage of three companies in different years.
Profit = Income – expenditure
Profit % = 
if the income of company A in 2008 is equal to expenditure of company B in 2007, find the ratio of profit of company A in 2008 to company B in 2007.
Question 7
Directions: Study the following graph carefully and answer the questions given below.
The following graph gives the profit percentage of three companies in different years.
The following graph gives the profit percentage of three companies in different years.
Profit = Income – expenditure
Profit % =
If the income of company B and C was equal in 2009, then what was the ratio of their expenditures?
Question 8
Directions: Study the following graph carefully and answer the questions given below.
The following graph gives the profit percentage of three companies in different years.
The following graph gives the profit percentage of three companies in different years.
Profit = Income – expenditure
Profit % =
Which company earned the minimum percentage profit for maximum number of years during the given period?
Question 9
Directions: Study the following graph carefully and answer the questions given below.
The following graph gives the profit percentage of three companies in different years.
The following graph gives the profit percentage of three companies in different years.
Profit = Income – expenditure
Profit % =
If company A and C has equal profit in 2010, then Income earned by company C is (approx.) what percent of the expenditures incurred by company A?
Question 10
Directions: Study the following graph carefully and answer the questions given below.
The following graph gives the profit percentage of three companies in different years.
The following graph gives the profit percentage of three companies in different years.
Profit = Income – expenditure
Profit % =
If the expenditure of company A keep on increasing every year, then in which year it has maximum income?
- 27 attempts
- 0 upvotes
- 0 comments
Oct 31IPM, CUET & BBA Exams

