PHASE
- A phase is a physically distinct, chemically homogeneous, and mechanically separable region in a system in equilibrium.
- If more than one phase is present in a given system, each phase will have its own distinct properties and a boundary separating it.
Gibb’s phase rule
F +P = C + 2
where, F = No. of degrees of freedom.
P: No of phases present.
C: No of components
Note: The degree of freedom is zero at the triple point.
Phase equilibrium:
- The consistency in the physical and chemical properties of the phase relative to time is the indication of the equilibrium.
- It does not give the idea of time gap needed to attain the equilibrium conditions.
Phase Diagram (equilibrium or constitutional diagram):
- It is a plot on temperature-composition scale showing the stability of different phases.
- It shows the relationship between temperature, the compositions and the quantities of phases present in an alloy system under equilibrium conditions.
- On the temperature change various microstructures develop and involve transition from one phase to another phase, which can be predicted by the phase diagrams.
Type of phase diagrams:
Unary phase diagram (single component):
Such phase diagram is used for carbon and pure metal and has limited practical application. These are plotted on temperature and Pressure axis.
Example: Water, graphite, metallic carbon, diamond.
Binary phase diagram (two components):
Type I: Binary Amorphous systems: Here, the materials are completely soluble in liquid as well as solid state.
(i). The most metals are completely soluble in solid slate thus solid phase is a type substitutional solid.
(ii). Here, the metals have similar crystal structure and the difference in their atomic radii is less than the 8%.
Example: Cu -Ni phase diagram

(i). The locus of the points where solidification starts is known as liquidous line (upper curved line in diagram), the locus of the points where there is end of solidification is known as the solidus line (Lower curved line in the diagram).
(ii). Above the liquids line, Area is single phase region and alloy forms homogeneous liquid solution. Similarly, region below solidus line is homogeneous in nature and alloys is in solid state.
(iii). A two-phase region i.e. mushy zone having both liquid and solid, exists between the solidus and liquidus line.
Rules to find the actual composition and relative amounts of phases present:
Rule 1. Chemical composition of phases:
In equilibrium condition, a tie line (a horizontal temperature line) between the the boundaries of the field is drawn to determine the actual chemical composition of the phases of an alloy and a vertical line corresponding to a specified composition is drawn as shown in figure. The intersection points on boundaries are extended to base line, and one can read composition directly.

Rule 2: Relative amount of each phase (Using Lever Rule):
- In equilibrium condition, a tie line (a horizontal temperature line) between the the boundaries of the field is drawn to determine the actual chemical composition of the phases of an alloy and a vertical line corresponding to a specified composition is drawn as shown in figure.
- The vertical line will intersect the horizontal line and divide it into two parts. The amount of phase present is inversely proportional to the lengths of these lines. This rule is called as Lever Rule.


Note:
For phase diagram only one parameter is changed thus Gibb’s rule reduced to:
![]()
TYPE-II: Materials having completely solubility in liquid state but partial solubility in solid state (eutectic phase diagram):
Partial solubility means that one component can form a solid solution with other only up to a maximum concentration.
Binary Eutectic system consists of three phases as follows:
(i) α
(ii) β (Solid solutions)
(iii) Liquid phase (L)
Here a eutectic point is defined, where degree of freedoms are zero.

α phase: It is rich in copper and Ag is present as solute and has FCC structure.
β phase: It is rich in Ag and Cu is present as solute and again has FCC structure.
(α + β) phase constitutes of pure copper (Cu) and pure silver (Ag).
Below line CEG (779°C), there is only partial solubility of Ag in Cu (a phase) and Cu in Ag (phase). Maximum solubility of Ag in Cu occurs at 779°C and is 8%.
Solvus line demarcates between α and (α + β) phases and β and (α + β) phases.
Different types of phase diagram reactions:
(i). Eutectoid reaction: Here a solid phase (α) directly transforms to two others solid phase (β) and (γ). Eutectoid means eutectic like. It is also an invariant reaction. It is denoted by point E.
(ii). Peritectic reaction: It involves three phases at equilibrium and upon cooling a solid and a liquid combine isothermally to form a new solid phase(β).

The new solid formed is usually an intermediate phase but in some case, it is terminal solid solution. Peritectic reaction occurs in alloys having large difference in melting point.
(iii). Peritectoid reaction: It involves reaction between two solid and final products will be solid.

(iv). Monotectic reaction:
![]()
Note:
Eutectic temperature is lowest melting point as compared to that for all other composition.
Iron-Carbon phase diagram:
- The Fe-Fe3C is defined by five individual phases and four invariant reactions. Five phases are:
(i). α-ferrite: C and iron (Fe) solid solution in alpha iron (BCC).
(ii). γ-austenite: C and iron (Fe) solid solution in Austenite (FCC iron).
(iii). δ-ferrite: C and iron (Fe) solid solution in delta iron
(iv). Fe3C (iron carbide) or cementite - an inter-metallic compound and liquid Fe-C solution. - Four invariant reactions are eutectic, Eutectoid, monotectic and peritectic.
- Pure iron upon heating exhibits two allotropic changes as shown below:
- Carbon present in solid iron as interstitial impurity, and forms solid solution with ferrites/austenite as depicted by three single fields represented by α, γ and δ. Carbon dissolves least in α -ferrite in which maximum amount of carbon soluble is 0.02% at 723°C.


Fe-C system constitutes four invariant reactions:
(a). Peritectic reaction: at 1495°C and 0.16%C.
δ-ferrite + L ↔ γ-iron (austenite)
(b). Monotectic reaction: 1495°C and 0.51%C.
L ↔ L+ γ-iron (austenite)
(c). Eutectic reaction: at 1147°C and 4.3%C.
L ↔ γ-iron + Fe3C (cementite)
The mixture of γ-iron + Fe3C (cementite) is called the ledburite.
(d). Eutectoid reaction at 723°C and 0.8%C.
γ-iron L ↔ α-ferrite + Fe3C (cementite) [pearlite]
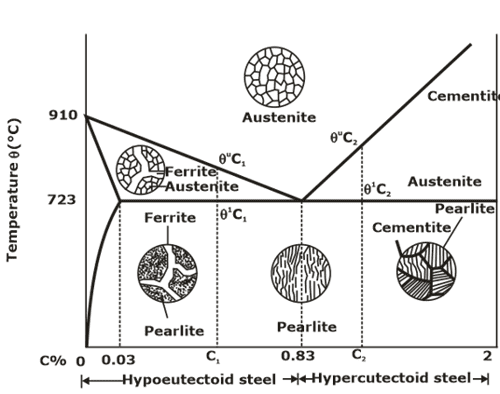
Fig.5: Microstructures of various phase of steel.
3.1 Time-temperature-transformation (TTT) diagrams
(i). The information on the change of phase with the cooling rate can be conveniently displayed with the help of a time-temperature-transformation diagram (commonly known as the TTT diagram). In such a diagram, the temperature is plotted along the vertical axis (using a linear scale), whereas the abscissa represents the time on a logarithmic scale.
(ii). Isothermal transformation diagram, also called as TTT diagram, measures the rate of transformation at a constant temperature i.e. it shows time relationships for the Phases during isothermal transformation. Information regarding the time to start the transformation and the time required to complete the transformation can be obtained from set of TTT diagrams.

Fig.5: Temperature-Time diagram
(iii). This temperature-time curve is also termed as S-curve or Ben-curve. The outer curve represents the starting of transformation and the inner curve represents the completion of transformation. At about 550°C, the transformation starts after a minimum lapse of time and the starting point of transformation at 550°C is called nose. A continuous cooling rate which touches the nose of temperature-time diagram is called critical cooling rate.
(iv). At transformation temperatures below 550°C, austenite results in different product known as bainite. This process is called Austempering. Bainite consists of α-ferrite and cementite phases.

Fig.6: Bainite formation
3.2. Martempering (or stepped quenching)
Martempering is performed in two steps, first the steel quenched in water to a temperature 300-400° C and then quickly transferred to a less temperature medium like oil where are held until it is completely cooled.
As this is done in step so it is called as stepped quenching, after heating steel to hardening temperature. It is quenched in a medium to a hardening temperature slightly above (240°C). The Holding time must be enough so that part reaches the temperature of ceding medium.
3.3 Austempering
Longer holding times as compared to martempering in hot bath. Austenite transforms to Bainite. Here molten salts & alkalies are used as quenching media. Temperature is maintain between 150°C-450°C. Here, sample has quenched below the nose of TTT diagram but above the martensite start line then it holds for longer period.
INTRODUCTION TO HEAT TREATMENT
- Heat treatment is a combination of heating and cooling operation and applied to a metal or alloy in the solid state in a way that will produce desired properties.
- All basic heat-treating processes for steel involve the transformation or decomposition of austenite.
- The nature and appearance of these transformation products determine the physical and mechanical properties of any given steel.
- The difference in temperature use within thick and thin section of articles of variable cross-section should be considered and whenever possible, provision should be made for slowing the heating of the thinner section to minimize thermal stress and dispersion.
Annealing: Annealing is a heat treatment process generally used to:
(i) Relieve internal stresses
(ii) Increase, softness, ductility and toughness
(iii) Produce a specific microstructure.
It consists of three stages:
(i) Heating to a desired temperature
(ii) Holding or Soaking' at that temperature
(iii) Cooling usually to room temperature.
- It is employed for low and medium carbon steels that will be experiencing plastic deformation during forming operation.
(a). Full annealing
Hypoeutectoid steel and hypereutectoid steel is heated above 50°C of upper critical line and lower critical line respectively. Then component is cooled slowly in furnace. Hence coarse grains are obtained resulting in decreased strength and hardness.
(b). Process annealing:
The hypoeutectoid steel is heated below the lower critical line. It relieves the back stresses and no change in microstructure occurs. It is only for low carbon steels.
(c). Spherodise annealing
It improves the machinability of medium and high carbon steel. The specimen is heated just below the lower critical temperature. The carbide in steel is transformed into globular form.
(d). Diffusion annealing
It makes the chemical composition uniform. The sample is heated to 1150°C and kept at that temperature for 6-8 hours and cooled slowly in furnace.
Normalizing
- Steels that have plastically deformed eg: a rolling operation, consists of grains of pearlite and a proeutectoid phase, which are irregularly shaped and relatively large and vary in size.
- Normalizing is used to refine these grains (i.e. to decreases average grain size) and produce more uniform and desirable size distribution.
- The microstructure formed is fine grained pearlite with a proeutectoid Phase.
- It is accomplished by heating alloy (55°C to 85°C) above the upper critical temperature , after sufficient time has been given to alloy to completely transform to austenite, the treatment is terminated by cooling in air. It raises hardness and strength of alloy but decreases ductility of steels.

Fig.7: Heat treatment
Tempering: It is done:
(i) To relive residual stress
(ii) To improve ductility
(iii) Toughness is increased.
(a). High temperature tempering (500-700°C)
Resulting structure is Sorbite, residual stress completely vanished.

Fig.8: Tempering of martensite.
(b). Medium temperature tempering (300-500°C)>
- Resulting in Troostite formation.
- After tempering work is cooled to water, leads to enhanced endurance strength.
- Due to increase in endurance limit, thus used for making "spring steels and die steels".
(c). Low temperature tempering (150°C-300°C):
- Holding time is 1-3 hrs.
- Apart from achieved properties in tempering, this process provides additional "wear resistance”.
- It enhances true tensile strength and hardness change by small extent.
- It is used for measuring & cutting tools.
Case hardening or Surface hardening methods:
- Its main objective is to achieve hard surfaces with relatively soft core and hard surface is called case.
- Hard surface provides good wear resistance while good toughness is the result of soft core. There are various treatments to impart surface hardness which are discussed below:
(a). Carburizing
- It is applied to low carbon steels having up to 0.18% C.
- Temperature range is between 870-950°C and result in the formation of Austenite phase, which has maximum solubility of carbon.
(i). Pack carburizing:
- Here, the pieces to be hardened are surrounded by a carburizing mixture and then packed in a steel box.
- It is heated to around 870-950°C.
- Carburizing mixture: 50% charcoal + 20% BaCO3 + 5% CaCO3 + 5-12% Na2CO3

Fig.9: Pack carburizing
(ii). Gas carburizing:
- Here work part is treated in a atmosphere of gases containing carbon and hydrocarbon gases such as CH4, butane etc.
- Here, the workpiece is heated to temperature of 950°C and held for 3-12 hours.
CH4 → 2H2 + C (atomic)
(iii). Liquid carburizing:
- Here, the part is heated to 950°C and it is kept in a molten salt bath having 20% NaCN, which gives Carbon (C) & Nitrogen (N).
- Carbon and small amount of Nitrogen diffuses into surface at this temperature.
- In carburizing operations carbon can be penetrated up to the depth of 0.3 mm with hardness obtained around (55-65 HRC).
(b). Nitriding:
- It is done by heating steel in the atmosphere of NH3 gas.
- Piece to be nitrided are placed in an airtight container, workpieces are heated to a temperature in range (500-600°C), at which NH3 dissociates into 2NH3 → 2N + 3H2
- This atomic nitrogen diffuses to the surface making case hardened.
1.4.3. Cyaniding
- Here work part is immersed in molten salt bath containing sodium cyanide (NaCN). which is heated to 820-860°C.
- This is usually followed by water quenching.
- The cyanide both consists of:
20-30% NaCN + 25-50% NaCl + 25-50% Na2CO3
1.5. Induction hardening
- Workpieces heated in an induction furnace surrounded by copper coils which are water cooled. High frequency AC current is passed through Cu coils and thus alternate magnetic field set up which induce eddy currents on the surfaces.
- Heat is generated on the surface by eddy currents.
- The surface of work piece is heated in austenitic range then quenched immediately to form martensite.
- The structure of core remains unchanged because it is not affected by heat.
- Heating rate is 300°/sec for hypoeutectoid steel and subsequently heating time is very small (2-50 sec.) quenching temperature depend upon rate of heating if the rate is 500°C/sec, it is 1000°C & if it is 250°C then 900°C.
1.6. Flame hardening
- Process consists of heating the surface of high carbon steels by a high temperature gas flame at 2400-3500°C, followed by immediate cooling is air or water.
- Heat is supplied by oxy-acetylene torch. The heat is supplied so quickly to the surface that the core remains unaffected.
- The thickness of hardened layer is 2-4 mm and its structure is martensite.

Fig.10: Flame hardening


Comments
write a comment