Combo Chart || Data Interpretation || CAT 2021 || 19 June
Attempt now to get your rank among 116 students!
Question 1
The line graph below shows the different principal amounts (in thousands) invested by Vishal on five different schemes (A, B, C, D and E) on compound interest. It also shows the rate of interest at which the principal amount is invested in different schemes and the time for the investment on different schemes.
(% rate of interest is an integer to nearest value )
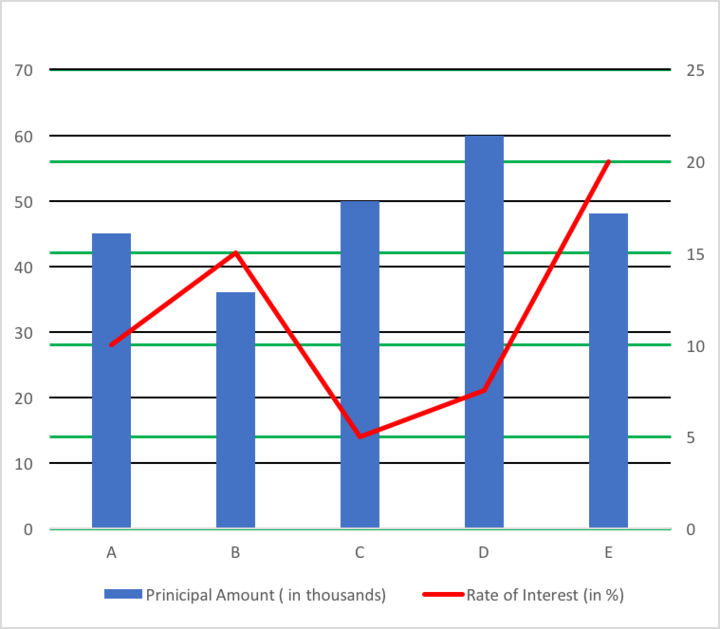
Note : *Secondary Axis represents rate of interest
*Primary Axis represents Principal Amount

Question 2
The line graph below shows the different principal amounts (in thousands) invested by Vishal on five different schemes (A, B, C, D and E) on compound interest. It also shows the rate of interest at which the principal amount is invested in different schemes and the time for the investment on different schemes.
(% rate of interest is an integer to nearest value )
Note : *Secondary Axis represents rate of interest
*Primary Axis represents Principal Amount
Question 3
The line graph below shows the different principal amounts (in thousands) invested by Vishal on five different schemes (A, B, C, D and E) on compound interest. It also shows the rate of interest at which the principal amount is invested in different schemes and the time for the investment on different schemes.
(% rate of interest is an integer to nearest value )
Note : *Secondary Axis represents rate of interest
*Primary Axis represents Principal Amount
Question 4
The line graph below shows the different principal amounts (in thousands) invested by Vishal on five different schemes (A, B, C, D and E) on compound interest. It also shows the rate of interest at which the principal amount is invested in different schemes and the time for the investment on different schemes.
(% rate of interest is an integer to nearest value )
Note : *Secondary Axis represents rate of interest
*Primary Axis represents Principal Amount
Question 5
The line graph below shows the different principal amounts (in thousands) invested by Vishal on five different schemes (A, B, C, D and E) on compound interest. It also shows the rate of interest at which the principal amount is invested in different schemes and the time for the investment on different schemes.
(% rate of interest is an integer to nearest value )
Note : *Secondary Axis represents rate of interest
*Primary Axis represents Principal Amount
Question 6
A shopkeeper sold 10 articles of 4 different types in an hour on a particular day.
The bar-graph given below shows the cost price and selling price of the 10 articles.
The centre of each figure represents the selling price of the article on the Y-Axis and cost price of the article on the X-Axis.

What is the average cost price of the glasses sold by the shopkeeper in the given hour?
Question 7
A shopkeeper sold 10 articles of 4 different types in an hour on a particular day.
The bar-graph given below shows the cost price and selling price of the 10 articles.
The centre of each figure represents the selling price of the article on the Y-Axis and cost price of the article on the X-Axis.
Question 8
A shopkeeper sold 10 articles of 4 different types in an hour on a particular day.
The bar-graph given below shows the cost price and selling price of the 10 articles.
The centre of each figure represents the selling price of the article on the Y-Axis and cost price of the article on the X-Axis.
Question 9
A shopkeeper sold 10 articles of 4 different types in an hour on a particular day.
The bar-graph given below shows the cost price and selling price of the 10 articles.
The centre of each figure represents the selling price of the article on the Y-Axis and cost price of the article on the X-Axis.
Question 10
A shopkeeper sold 10 articles of 4 different types in an hour on a particular day.
The bar-graph given below shows the cost price and selling price of the 10 articles.
The centre of each figure represents the selling price of the article on the Y-Axis and cost price of the article on the X-Axis.
- 116 attempts
- 0 upvotes
- 0 comments

