Time Left - 08:00 mins
Approximation & Line Graph II Quantitative Aptitude II MH-CET 2021 II 30 June
Attempt now to get your rank among 113 students!
Question 1
Direction: What approximate value will come in place of the question mark (?) in the following question? (You are not expected to calculate the exact value)
Question 2
Direction: What approximate value should come in place of the question mark (?) in the given question? (You are not supposed to calculate the exact value).
103.1% of 640.01 – 3/7 % of 6300.12 + 11.999 =?
Question 3
Direction: What approximate value will come in place of the question mark (?) in the following question? (You are not expected to calculate the exact value)
104.93 % of 8401.02 – % of 5599.97 + 9.999 = ?
Question 4
Direction: What approximate value will come in place of the question mark (?) in the following question? (You are not expected to calculate the exact value.
( 254.87  12
12  9.99)
9.99)  49.99 = 55.986 + (23.99)2 + ? - 32.48
Question 5
Direction: What approximate value will come in place of the question mark (?) in the following question? (You do not have to calculate the exact value)
7% of 299.95 ×  % of 728.94 + 40% of 5559.92 = ?
Question 6
Direction: The line graph provided below gives the data of the production of sugar (in lakh tonnes) by three different companies P, Q and R over the years. Study the graph and answer the questions that follow:
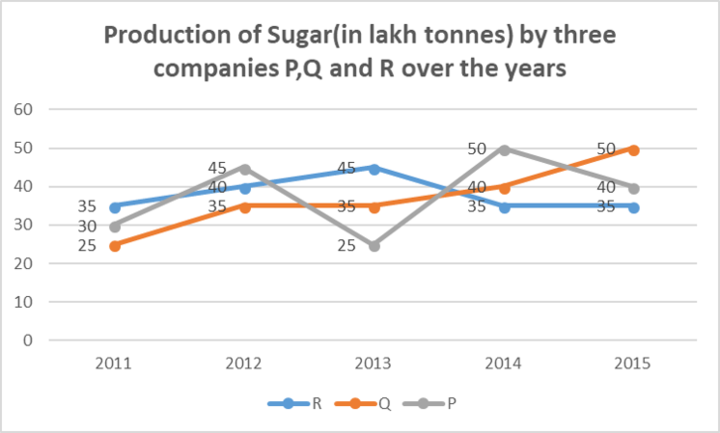
What is the ratio of the average production of company P in the period 2013 to 2015 to the average production of company Q in the same period?
Question 7
Direction: The line graph provided below gives the data of the production of sugar (in lakh tonnes) by three different companies P, Q and R over the years. Study the graph and answer the questions that follow:
What is the percentage increase in the production of the company Q from 2011 – 2014?
Question 8
Direction: The line graph provided below gives the data of the production of sugar (in lakh tonnes) by three different companies P, Q and R over the years. Study the graph and answer the questions that follow:
The average production for five years was maximum for which company?
Question 9
Direction: The line graph provided below gives the data of the production of sugar (in lakh tonnes) by three different companies P, Q and R over the years. Study the graph and answer the questions that follow:
For which of the following years, the percentage rise/fall in production from the previous year is the maximum for company Q?
Question 10
Direction: The line graph provided below gives the data of the production of sugar (in lakh tonnes) by three different companies P, Q and R over the years. Study the graph and answer the questions that follow:
In which year, the production of Company R as a percentage of the production of company Q was maximum?
- 113 attempts
- 0 upvotes
- 0 comments
Nov 2CAT & MBA

