Time Left - 10:00 mins
Line Graph & Bar Graph II Quantitative Aptitude II MH-CET 2021 II 3 August
Attempt now to get your rank among 196 students!
Question 1
Direction: Study the line graph carefully and answer the following questions.
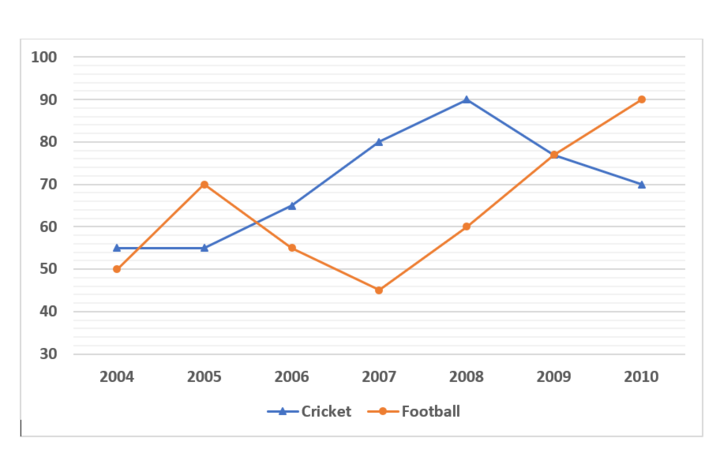
In the line graph percentage of profit earned from the organizing the Cricket and Football game is given.
In the line graph percentage of profit earned from the organizing the Cricket and Football game is given.
If the profit by the audience in 2006 by Cricket is Rs.910000, what was the income in football in that year? (In 2006 Incomes for both sports through the audience were same.)
Question 2
Direction: Study the line graph carefully and answer the following questions.
In the line graph percentage of profit earned from the organizing the Cricket and Football game is given.
In the line graph percentage of profit earned from the organizing the Cricket and Football game is given.
If the amount invested in cricket and football in 2005 was equal, what is the ratio of the total income of cricket to that of football in 2005?
Question 3
Direction: Study the line graph carefully and answer the following questions.
In the line graph percentage of profit earned from the organizing the Cricket and Football game is given.
In the line graph percentage of profit earned from the organizing the Cricket and Football game is given.
If the Investment in cricket in 2007 and 2008 were equal, what is the difference between the profits earned in two years, if the income in 2007 Rs.29,700,00?
Question 4
Direction: Study the line graph carefully and answer the following questions.
In the line graph percentage of profit earned from the organizing the Cricket and Football game is given.
In the line graph percentage of profit earned from the organizing the Cricket and Football game is given.
If the amount invested in football in 2004 is 15 lakhs and the income of 2004 is equal to the investment in 2005, what is the profit earned in 2005 in football?
Question 5
Direction: Study the line graph carefully and answer the following questions.
In the line graph percentage of profit earned from the organizing the Cricket and Football game is given.
In the line graph percentage of profit earned from the organizing the Cricket and Football game is given.
If the profit by audience in 2010 by cricket is Rs.398000, what was the income in cricket in that year (approx)?
Question 6

In 2017, company C employees are 20% more than the company D employees. In 2018, company C employees is what percent more/less than the company D employees?
Question 7
Total employees of company A in 2017 and 2018 together and Total employees of company E in 2017 and 2018 together are 5100 and 5160 respectively. Find difference of number of employees in A in 2017 to number of employees in company E in 2017?
Question 8
In 2017, number of employees in company C increases by 150% as compared to previous year. Find the ratio between number of employees in company C in 2016 to in 2018?
Question 9
Find the ratio of number of employees in company F in 2017 to the number of employees in company C in 2017 if in 2018 respective ratio between company F to company C employees is 3 : 2.
- 196 attempts
- 0 upvotes
- 2 comments
Dec 24CAT & MBA

