Mega Quant Weekly Revision Quiz II MH-CET 2021 II 15 August
Attempt now to get your rank among 184 students!
Question 1
Direction:In the following number series, only one number is wrong. Find out the wrong number.
87, 106, 68, 125, 45, 144
Question 2
Direction: In the following number series only one number is wrong. Find out that wrong number.
144, 216, 72, 108, 36, 56, 18
Question 3
Direction: In the following number series, only one number is wrong. Find out the wrong number.
17, 13, 40, 24, 149, 117, 456
Question 4
Direction:In the following number series, only one number is wrong. Find the wrong number.
3, 4, 10, 21, 80, 405, 2424
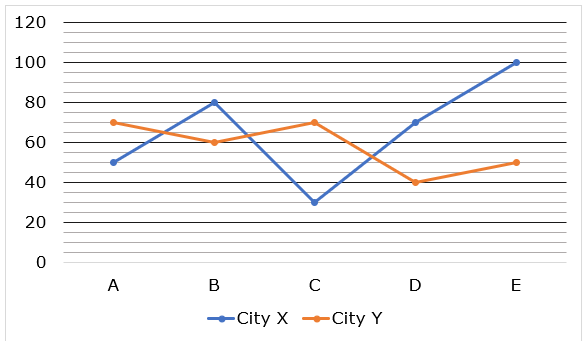
Question 5
Direction: Study the following graph carefully and answer the given questions.
The line graph given below shows the number of employees who are present in the following five companies on a particular day in two different cities.
Note:Some employees from each city are not present on that day and both cities have only these five companies.
The number of employees present in A in both the cities together is approximately what percent of the sum of the number employees of D present in city Y and number of employees of E present in city X?
Question 6
Direction: Study the following graph carefully and answer the given questions.
The line graph given below shows the number of employees who are present in the following five companies on a particular day in two different cities.
Note:Some employees from each city are not present on that day and both cities have only these five companies.
If 80% of the employees present in city X are females and 40% of the employees present in city Y are males then find the ratio of the number of males present in city X to that of in city Y.
Question 7
Direction: Study the following graph carefully and answer the given questions.
The line graph given below shows the number of employees who are present in the following five companies on a particular day in two different cities.
Note:Some employees from each city are not present on that day and both cities have only these five companies.
If in another city Z there are only two companies A and B and in company A number of employees are 20% more than the number of employees present in company A in city X and number of employees in company B of city Z is 80% of the number of employees present in company A in Y, find total number of employees in city Z.
Question 8
Direction: Study the following graph carefully and answer the given questions.
The line graph given below shows the number of employees who are present in the following five companies on a particular day in two different cities.
Note:Some employees from each city are not present on that day and both cities have only these five companies.
Find the difference between the average number of employees present in B, C, and E of city X and the average number of employees present in A, C, and D of city Y.
Question 9
Direction: Study the following graph carefully and answer the given questions.
The line graph given below shows the number of employees who are present in the following five companies on a particular day in two different cities.
Note:Some employees from each city are not present on that day and both cities have only these five companies.
If one-fourth of the employees in city X is not present and the total number of employees in city Y is 90% of the total employees in city X, find the number of employees of city Y who are not present.
Question 10
Direction: Study the Pie-chart given below to answer the following questions.
The pie-chart given below shows the percentage distribution of number of registered voters in 5 different villages i.e., P, Q, R, S and T.
If 20% of the registered voters in village Q did not cast their vote and 10% of votes cast were found invalid, then find the number of valid votes cast in village Q.
Question 11
Direction: Study the Pie-chart given below to answer the following questions.
The pie-chart given below shows the percentage distribution of number of registered voters in 5 different villages i.e., P, Q, R, S and T.
In village R, 10% of registered voters did not cast their vote and no vote was invalid from the votes which were cast. The winning candidate defeated the other candidate by 12% of votes cast. Find the number of votes obtained by losing candidate. (There are only 2 candidates contesting in elections in village R)
Question 12
Direction: Study the Pie-chart given below to answer the following questions.
The pie-chart given below shows the percentage distribution of number of registered voters in 5 different villages i.e., P, Q, R, S and T.
Find average of number of registered voters in village Q, R and S together?
Question 13
Direction: Study the Pie-chart given below to answer the following questions.
The pie-chart given below shows the percentage distribution of number of registered voters in 5 different villages i.e., P, Q, R, S and T.
In village P, Q, S & T, votes were cast by only 70%, 65%, 80% and 75% of registered voters respectively. From which village among P, Q, S and T did maximum voters cast their votes?
Question 14
Direction: Study the Pie-chart given below to answer the following questions.
The pie-chart given below shows the percentage distribution of number of registered voters in 5 different villages i.e., P, Q, R, S and T.
Average number of registered voters from village P and R together is what percent of average number of registered voters from village Q, S and T together?
Question 15
Direction: Given below are two quantities named I and II. Based on the given information, you have to determine the relation between the two quantities. You should use the given data and your knowledge of Mathematics to choose among the possible answers.
Quantity I: Cost price of article. If an article is sold at 8% profit instead of 8% loss, it would have brought Rs. 20 more. Quantity II: Initial cost price of the book. A man sells a book at a profit of 20%. If he had bought it at 20% less and sold it for Rs. 25 less he would have gained 25%.
Question 16
Direction: Given below are two quantities named I and II. Based on the given information, you have to determine the relation between the two quantities. You should use the given data and your knowledge of Mathematics to choose among the possible answers.
Quantity I: Profit share of Karan out of the total profit of Rs. 4120 after two years. Tarun, Karan and Varun started a business with initial investments in the ratio 8 : 5 : 12, respectively. After one year, Tarun, Karan and Varun made additional investments of Rs. 1800, Rs. 660 and Rs. 840, respectively.
Quantity II: Rs. 832
Question 17
Direction: Given below are two Quantities named I and II. Based on the given information, you have to determine the relation between the two quantities. You should use the given data and your knowledge of Mathematics to choose among the possible answers.
Quantity I: Fraction of work remains after 7 days. Aman can alone do a piece of work in 24 days and Dinesh can do alone the same work in 18 days. Aman and Dinesh work together.
Quantity II: The value of x, if 49x = 23(1 − x)
Question 18
A bag contains 6 red balls and 7 white balls. Another bag contains 5 red balls and 3 white balls. If one ball is selected from each of the bag, then find the probability that one of the ball is red and the other is white.
Question 19
From a group of 5 men and 10 women, a committee has to be formed of 5 members in which at least 4 men are required. The committee can be formed in ________ ways.
Question 20
A bag contains 7 black, 5 red and 6 blue balls. 2 balls are drawn at random, what is the probability that both the balls are blue?