Time Left - 10:00 mins
Wrong Number Series & Bar Graph II Quantitative Aptitude II MH-CET 2021 II 19 August
Attempt now to get your rank among 318 students!
Question 1
Direction: Find out the wrong number in the following number series.
7, 12, 48, 258, 2056, 20550
Question 2
Directions: Which term does not fit in the given series?
128, 384, 192, 576, 288, 884
Question 3
Directions: Which one of the following numbers is not correct in given number series?
5, 6, 8, 31, 116, 605, 3594
Question 4
Direction: In the following number series only one number is wrong. Find out the wrong number.
6642, 6617, 6536, 6415, 6246, 6021, 5732
Question 5
Direction: Find the wrong term in the given series:
3, 7, 12, 28, 50, 105, 204
Question 6
Direction: Study the following graph carefully to answer the questions that follow:
Bar graph given below shows the number of students (in hundreds) from two different schools who qualified in an exam in six different years (from year 2005 to 2010)
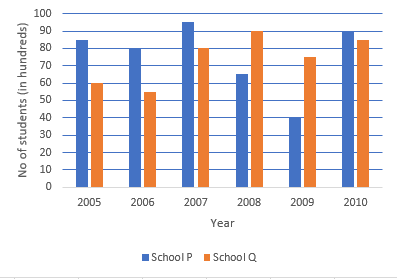
What was the approximate percent increase in the number of students who qualified in the exam from School-Q in the year 2007 as compared to the previous year?
Question 7
Direction: Study the following graph carefully to answer the questions that follow:
Bar graph given below shows the number of students (in hundreds) from two different schools who qualified in an exam in six different years (from year 2005 to 2010)
What was the respective ratio between the number of students who qualified in the exam from School-P in year 2005 to the number of students who qualified in the exam from School-Q in year 2008?
Question 8
Direction: Study the following graph carefully to answer the questions that follow:
Bar graph given below shows the number of students (in hundreds) from two different schools who qualified in an exam in six different years (from year 2005 to 2010)
What was the difference between the total number of students who qualified in the exam in year 2005 from both the schools together and the total number of students from School-Q who qualified in the exam over all the years together?
Question 9
Direction: Study the following graph carefully to answer the questions that follow:
Bar graph given below shows the number of students (in hundreds) from two different schools who qualified in an exam in six different years (from year 2005 to 2010)
Total number of students who qualified in the exam from School-P over all the years together was approximately what percentage of the total number of students who qualified in the exam from both the schools together in the year 2006 and 2007?
Question 10
Direction: Study the following graph carefully to answer the questions that follow:
Bar graph given below shows the number of students (in hundreds) from two different schools who qualified in an exam in six different years (from year 2005 to 2010)
If 40 per cent of the total students who qualified in the exam from both the schools together over all the years are females, then what was the total number of males who qualified in the exams over all the years from both the schools together?
- 318 attempts
- 3 upvotes
- 0 comments
Aug 19CAT & MBA

